
THE AUTHOR:

Checkout friction is often addressed through visible changes such as shortening forms, removing steps, or adding new payment methods. These improvements can help, but they may fail when teams lack sufficient data to identify where customers leave the flow and what actually caused the drop-off.
A decline at the payment stage is not necessarily a UX problem. It may result from failed authorization, authentication issues, gateway errors, fraud controls, inventory changes, pricing recalculations, shipping failures, or broken data exchange between commerce systems. Without connected behavioral, payment, and order data, these scenarios can appear identical in a standard checkout funnel.
This article explains how eCommerce teams can build a complete checkout analytics framework, determine which data to collect across the customer journey, connect commerce and payment systems, monitor the right KPIs, and use behavioral analytics to identify problems before redesigning payment flows or introducing new payment methods.
What is checkout friction?
In eCommerce, barriers to purchase can arise at different stages of the checkout journey, and identifying the stage is critical before choosing an optimization strategy. A visible drop in completion may reflect a usability issue, a failure in commerce operations, or a payment-processing problem, even when all three produce the same outcome in a standard funnel.
How do UX, operational, and payment issues differ?
UX friction is created by the customer-facing experience. Lengthy forms, unclear validation, poor mobile usability, forced account creation, or late disclosure of delivery costs can increase the effort required to complete a purchase and cause customers to abandon their carts before submitting an order.
Operational friction occurs when underlying commerce processes fail to consistently support the journey. Inventory may change during checkout, shipping options may not be returned, promotions may fail during recalculation, or an order may not be created correctly after the customer has already completed the required steps. In these cases, redesigning the interface does little to address the underlying cause.
Payment friction begins when the transaction moves into authentication, authorization, fraud screening, or payment processing. Issuer declines, 3D Secure failures, gateway errors, processing timeouts, risk controls, and unsuccessful retries can all prevent a purchase from completing, even when customer intent is clear.
These scenarios require different data, owners, and corrective actions. A customer who exits before submitting payment, a customer whose card is declined by an issuer, and a customer whose authorized transaction fails during order creation may all appear as lost conversions.
How do these issues affect conversion, revenue, and retention?
The immediate effect is a lower checkout completion rate, but the business impact extends beyond a single lost order. Technical failures can result in unrecovered revenue; repeated attempts can increase payment-processing and support overhead; and inconsistent pricing, inventory, or payment outcomes can weaken customer confidence in future purchases.
Teams should identify the stage and cause of each drop-off before choosing a UX design, payment, or architecture change. That requires combining behavioral signals with operational, payment, and order data before deciding whether the next step should be a UX change, a payment intervention, or an improvement to the supporting commerce architecture.
What data should be collected before optimizing the checkout process?
A useful checkout dataset should capture the full transaction path: what the customer did, how the cart changed, which systems responded, what happened during payment, and whether the purchase resulted in a valid order. This requires connected behavioral, commerce, payment, and operational data with consistent identifiers across the journey.
Dior Data Hub faced inefficient order processing and lengthy checkout times. Computools developed a custom CMS to manage customer orders and product data and to collect sales statistics. The resulting platform reduced checkout time, increased user throughput and average order value, and lowered the workload on the support system. These improvements covered the checkout experience and the operational processes that support it.
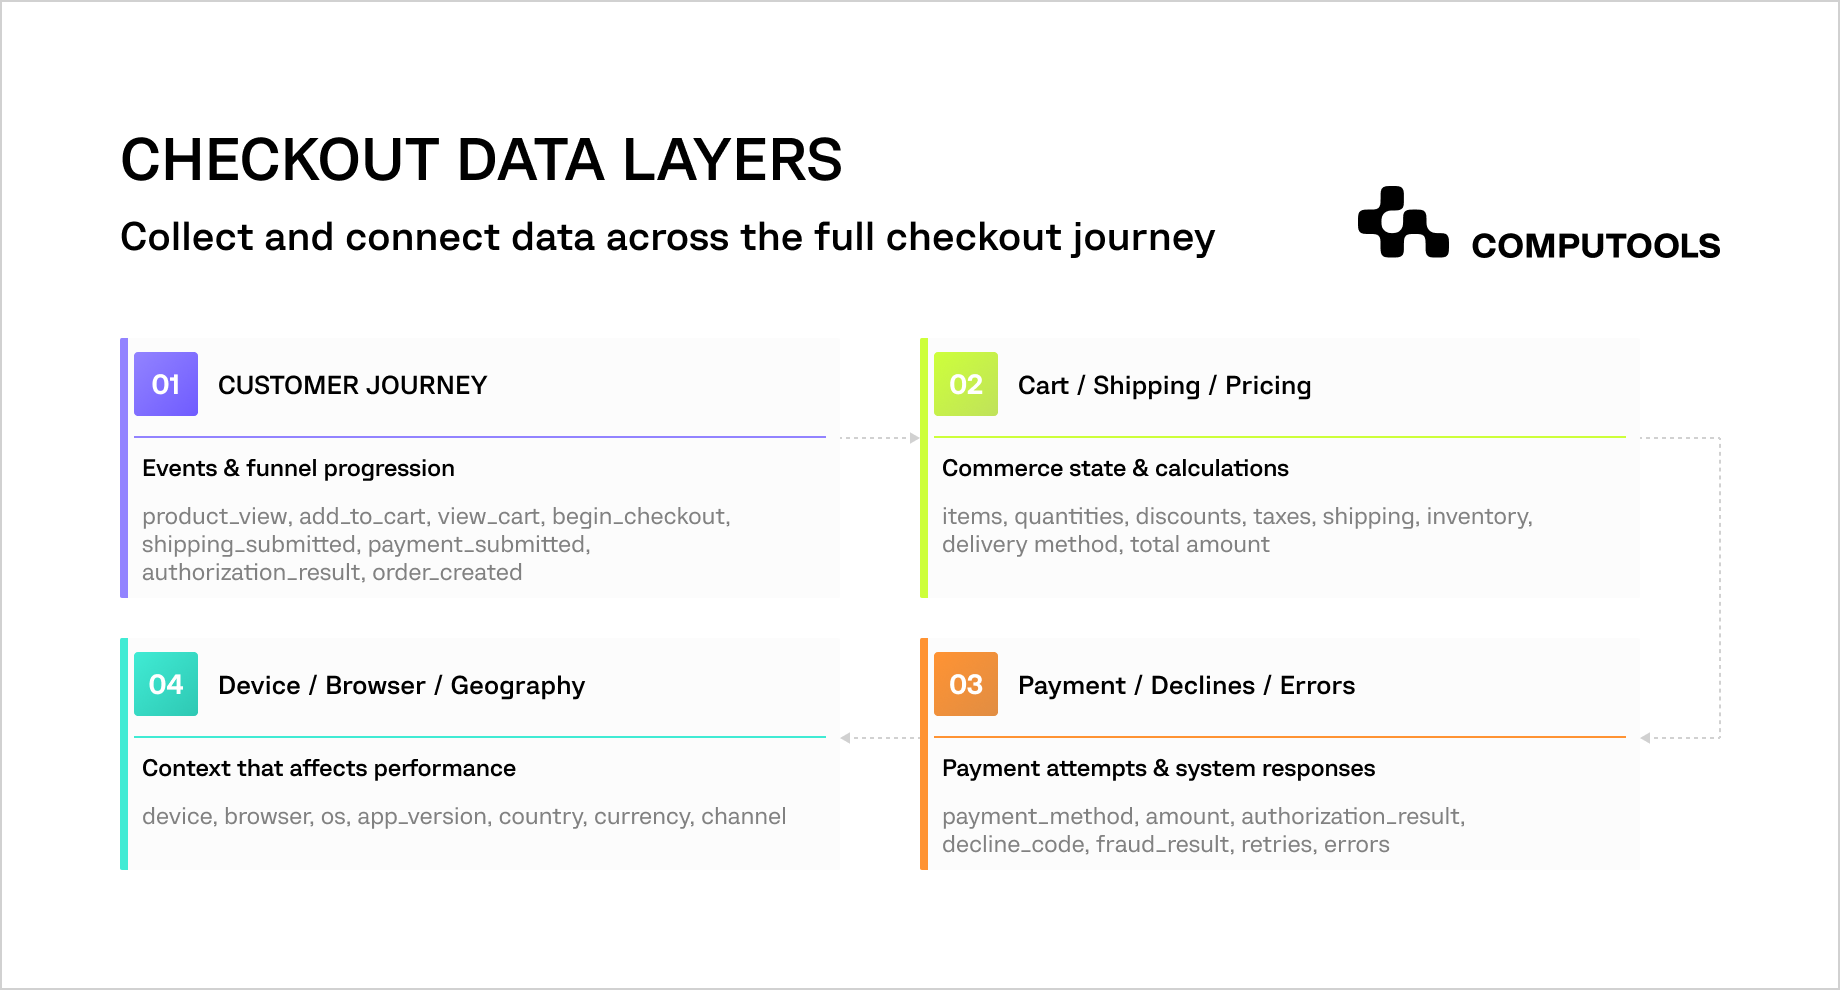
Figure 1. Checkout data layers required for end-to-end checkout analysis
Which customer journey and funnel events should be captured?
Customer activity should be recorded as a sequence of meaningful commerce events that can be reconstructed session by session. A typical sequence may include:
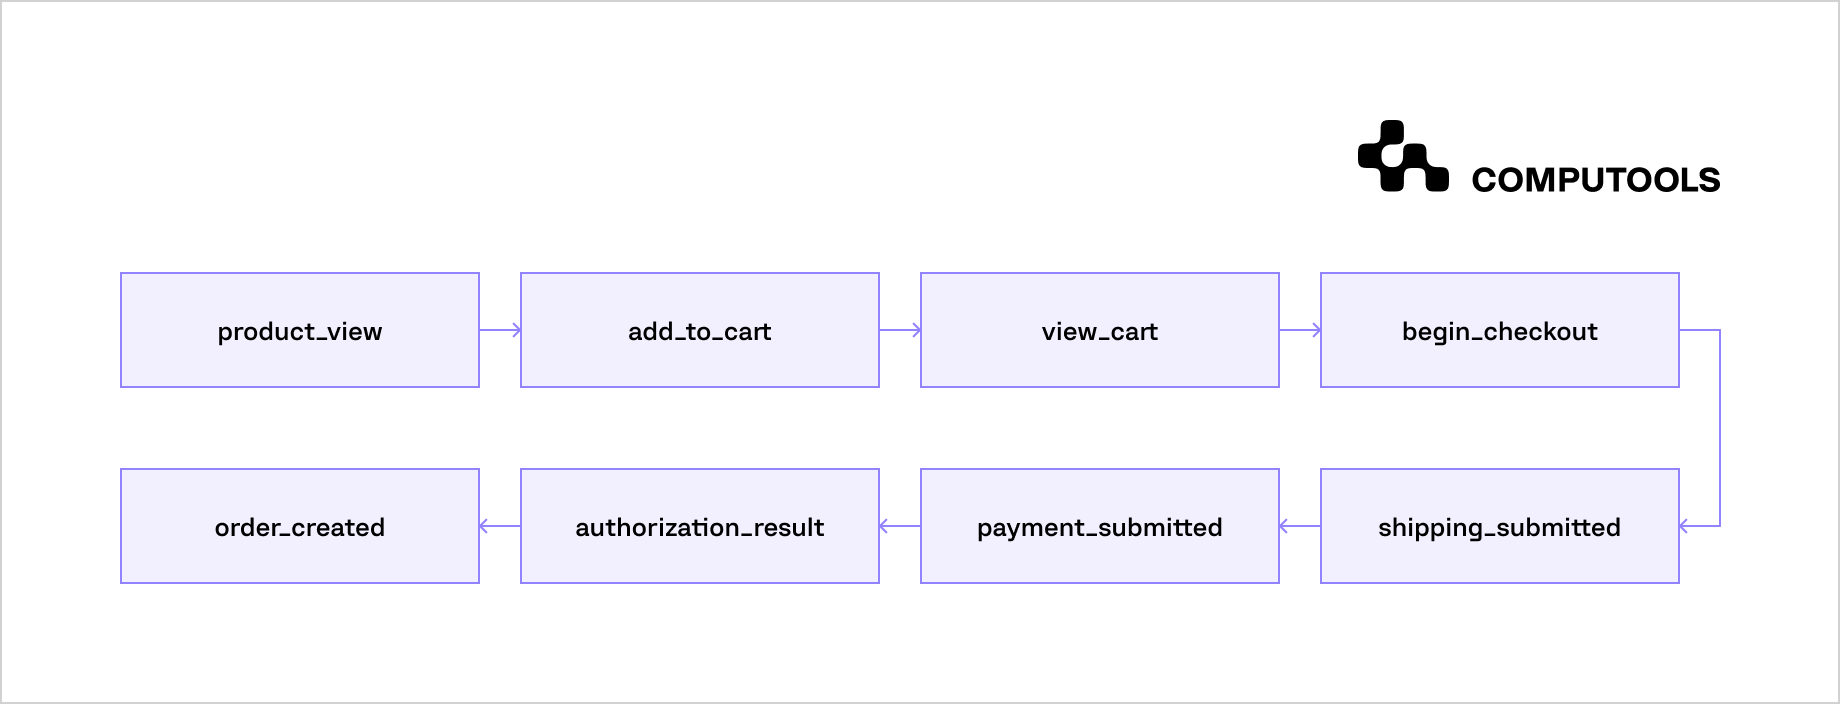
Figure 2. Example sequence of checkout events from product view to order creation.
Each event should carry the identifiers and context required to connect it with the rest of the transaction:
- event name and timestamp;
- session ID;
- customer or anonymous ID;
- cart ID;
- checkout stage;
- payment attempt ID;
- order ID, once created;
- channel and source system.
Funnel progression should capture successful transitions, exits, and failures at each stage. These events form the basis for ecommerce checkout metrics such as checkout completion, stage conversion, payment success, and time to checkout.
The event sequence also helps distinguish very different outcomes that can otherwise appear as the same drop-off. A customer may leave before submitting payment, receive an issuer decline, encounter a gateway error, or complete payment only to have order creation fail downstream.
Which cart, shipping, and pricing data should be retained?
Checkout analytics should preserve the cart’s commercial state at points where it changes.
Relevant data includes:
- product and variant IDs;
- quantities;
- subtotal;
- discounts and promotion IDs;
- taxes;
- shipping charges;
- currency;
- inventory status;
- delivery method;
- final payable amount.
Changes should remain traceable throughout the session. If the total increases after shipping is calculated, a promotion expires, inventory becomes unavailable, or no delivery option can be returned, that event may explain the subsequent drop in progression.
Linking exits to pricing, availability, and fulfillment events helps identify checkout abandonment reasons.
What payment authorization and decline data should be collected?
Payment data should preserve each attempt and its outcome as a separate event linked to the same cart and checkout session.
A practical payment record should include:
- payment attempt ID;
- payment gateway or processor;
- payment method;
- transaction amount and currency;
- authentication status;
- authorization result;
- decline or refusal code;
- fraud or risk outcome;
- processing latency;
- retry number;
- final payment state.
The failure taxonomy should distinguish issuer declines, authentication failures, fraud blocks, technical errors, customer cancellations, and unsuccessful retries. These outcomes require different analyses and different corrective actions.
Retry attempts should remain linked to the original transaction. Otherwise, repeated attempts from the same customer can inflate failure counts and distort authorization and payment success metrics.
Sensitive cardholder data should stay outside the analytics environment. PSP identifiers, tokens, normalized payment attributes, and operational metadata are sufficient for most checkout analysis.
How should checkout errors be structured?
Errors should be stored as structured events with enough context to identify the affected system and checkout stage.
Useful fields include:
- error category;
- technical code;
- timestamp;
- source system or service;
- checkout stage;
- correlation ID;
- user-visible result;
- recovery status.
A consistent taxonomy can separate frontend validation errors, application failures, API errors, payment processor failures, shipping or tax service failures, inventory conflicts, and order creation errors.
Structured error events allow failures to be compared by checkout stage, source system, release, provider, and integration.
Why should device, browser, and geography be part of the dataset?
Checkout performance can vary significantly across technical environments and markets, so these dimensions should be captured from the beginning. Device type, browser, operating system, app version, country, currency, sales channel, and payment method can reveal problems hidden by aggregate results. A checkout may remain stable overall while one browser, mobile release, market, or payment option experiences a sharp decline.
For larger commerce environments, data engineering services help establish the event schemas, identifiers, pipelines, and reconciliation rules needed to connect these datasets. The result should be a traceable transaction history that links customer behavior with payment and order outcomes.
The complete checkout data model
Collecting checkout data is only the first step. eCommerce teams also need a structured model that connects customer activity, payment outcomes, order creation, inventory changes, promotion logic, and fraud decisions into one transaction view. Without this structure, the business can see isolated events but still struggle to explain why a purchase failed or where revenue leakage began.
The data model should follow the checkout lifecycle from customer interaction to final order status. Its purpose is to connect events across systems through shared identifiers, timestamps, and consistent event definitions. This gives teams a reliable basis for performance analysis, issue diagnosis, and payment optimization.
In the Dior Data Hub project, Computools developed a custom CMS for customer orders, product data, and sales statistics. The platform was designed to improve order processing and reduce checkout time while supporting higher transaction volumes.
For a broader view of how retail businesses can centralize orders, inventory, customer behavior, and other event streams, see our guide on how to build a retail data warehouse with Kafka and BigQuery.
Which customer events should the data model include?
Customer events should describe how a shopper moved through the journey and where progression slowed or stopped.
Typical records include:
- product views;
- variant selection;
- add-to-cart;
- cart view;
- checkout start;
- shipping submission;
- payment submission;
- checkout exit;
- order confirmation view.
Each event should be tied to core identifiers such as session ID, customer or anonymous ID, cart ID, checkout ID, timestamp, device, browser, geography, and channel. These fields allow teams to reconstruct the journey and compare behavior across segments.
Customer events answer questions such as:
1. Which stage has the highest drop-off?
2. Did the customer leave before or after submitting payment?
3. Did the same user retry checkout in the same session?
4. Did the issue affect one device type, browser, or market more than others?
What should the payment event model capture?
Payment events should describe the full lifecycle of a transaction attempt, including intermediate states and final outcomes.
Key fields typically include:
- payment attempt ID;
- related cart ID and order ID;
- payment gateway or processor;
- payment method;
- transaction amount and currency;
- authentication status;
- authorization result;
- decline or refusal code;
- fraud or risk decision;
- retry number;
- processor latency;
- final payment state.
This structure helps separate issuer declines, authentication failures, technical processor errors, fraud blocks, and customer-initiated cancellations. Those outcomes may all reduce conversion, but they point to different operational and commercial decisions.
The model should also preserve the relationship between original attempts and retries. That prevents the same failed purchase from appearing as several unrelated transactions.
How should order events be modeled?
Order events should confirm whether a checkout session was successful and resulted in a valid order, and how that order progressed afterward.
Important records include:
- order created;
- order accepted or rejected;
- payment attached to order;
- confirmation sent;
- order canceled;
- refund initiated, where relevant.
Useful fields include order ID, cart ID, customer ID, order value, currency, order status, timestamp, channel, payment status, fulfillment status, and source system. Order events verify whether an authorized payment resulted in a valid order. They should capture order-creation failures, delayed confirmations, and status mismatches between payment and downstream systems.
Why should inventory be part of the checkout data model?
Inventory affects both customer progression and operational validity, so it belongs in the core model.
Relevant inventory data may include:
- SKU and variant ID;
- available stock;
- reserved stock;
- inventory location;
- inventory status at checkout;
- timestamp of availability changes.
This allows analysts to connect a cart or checkout failure with a stock issue. An item may be visible on the product page and present in the cart, then become unavailable before the order is created. That sequence should remain traceable within the same transaction record.
How should promotions be represented?
Promotions should be modeled as separate commercial events because pricing changes during checkout often affect progression.
Important promotion fields include:
- promotion or coupon ID;
- applied or rejected status;
- discount amount;
- rejection reason;
- stage at which the change occurred;
- updated cart total.
Promotion events should record when a discount is removed, a code is rejected, or a recalculation changes the payable amount. These events frequently influence checkout abandonment and should be analyzed together with cart and pricing changes.
What fraud signals should be included?
Fraud data should show how risk controls influenced the transaction and whether a legitimate customer encountered an avoidable barrier.
Typical fraud-related fields include:
- fraud or risk score;
- rule-based decision;
- step-up authentication request;
- manual review status;
- blocked or approved outcome;
- timestamp of the decision.
Risk controls can challenge, delay, or block a transaction before an issuer decision is returned. These events should remain visible in the same model as payment and order outcomes.
How should these domains be connected?
A complete checkout data model depends on shared identifiers across all domains.
The most important links usually include:
- session ID to connect browsing and checkout behavior;
- customer ID to group known-user activity across sessions;
- cart ID to connect cart changes with payment and order outcomes;
- payment attempt ID to track authorization, declines, and retries;
- order ID to connect successful checkout completion with downstream order processing.
Preserving these identifiers creates a traceable record from session to order and isolates failures in checkout, payment, and downstream processing.
Where checkout performance breaks down
Checkout losses can originate before the formal checkout begins and persist after payment authorization, so performance should be monitored across the entire purchase path.
A stage-level view helps teams connect a visible drop in conversion with the operational event behind it. The same decline in completed orders may come from a product availability issue, a cart recalculation, a failed shipping response, a payment problem, or an order creation error.
| Stage | What should be monitored | Key KPIs |
| Product selection | variant availability, inventory response, add-to-cart errors, page or app performance | product-to-cart rate, add-to-cart success rate, inventory error rate |
| Cart | cart changes, promotion results, stock updates, subtotal and total recalculations | cart abandonment rate, cart-to-checkout rate, cart error rate |
| Shipping and pricing | address validation, delivery method availability, shipping cost, tax and total changes | shipping-step completion rate, shipping error rate, pricing recalculation rate, time to shipping response |
| Payment | payment submission, authentication, authorization, declines, fraud decisions, retries | payment submission rate, authorization rate, payment success rate, decline rate, retry success rate, payment latency |
| Order completion | order creation, payment-to-order reconciliation, confirmation delivery | checkout completion rate, order creation failure rate, payment-to-order success rate, confirmation latency |
1. Before the payment stage
Problems that appear later in the funnel can begin earlier. A product may be available when the customer opens the page and becomes unavailable in the cart. A promotion can change the payable amount after checkout starts. Shipping availability or pricing can also affect whether the customer reaches payment at all.
Checkout abandonment reasons should be tied to the stage and event immediately preceding the exit. A customer leaving after seeing a shipping cost is a different case from a checkout that stops because the delivery service returns no valid option.
Front-end monitoring also matters here. Page errors, failed requests, slow responses, or browser-specific issues can affect progression even when commerce and payment systems remain healthy. These signals should be included in web development monitoring and release diagnostics for customer-facing checkout flows.
2. Payment processing and authorization
The payment stage requires more granular monitoring because several independent systems can influence the outcome.
A team should separate:
- payment form submission;
- authentication result;
- authorization request;
- issuer decline;
- fraud or risk block;
- processor or gateway error;
- retry;
- final payment status.
The key metrics are payment submission rate, authorization rate, payment success rate, decline rate, retry success, and processing latency. These should be segmented by gateway, payment method, geography, device, currency, and release version where the data is available.
A lower payment success rate alone does not identify the cause. The underlying event distribution shows whether the change came from customer behavior, issuer decisions, authentication, fraud controls, or technical failures.
3. Order completion and reconciliation
An authorized payment does not complete the commercial process. The order still has to be created, accepted by the relevant commerce systems, and confirmed to the customer.
This stage should track:
- authorized payments that did not produce an order;
- order creation failures;
- mismatches between payment and order status;
- duplicate order events;
- delayed or failed confirmation.
In the Dior Data Hub project, Computools developed a custom CMS to manage customer orders and product data and to collect sales statistics. The platform reduced checkout time and increased user throughput.
Assign each major loss to a stage, event, and system, then prioritize the corresponding fix.
Connecting commerce systems
Checkout analytics depend on consistent data exchange across the commerce stack. The eCommerce platform records customer actions and cart state, the payment gateway returns transaction outcomes, the OMS manages the order lifecycle, and inventory, ERP, CRM, analytics, and CDP systems add the operational and customer context required for analysis.
A practical software architecture assigns each system a clear source-of-truth role and connects records through shared identifiers such as customer ID, session ID, cart ID, payment attempt ID, and order ID.
| System | Primary role | Data used in checkout analytics |
| eCommerce platform | Manages storefront, cart, checkout, pricing, and customer-facing interactions | session events, cart state, checkout stages, pricing, shipping selections |
| CRM | Stores customer and relationship data | customer ID, profile attributes, purchase history, service interactions |
| OMS | Manages order creation and lifecycle | order ID, order status, cancellations, fulfillment state |
| ERP | Holds financial and operational records | invoices, taxes, product records, transaction and accounting data |
| Payment gateway | Processes authentication and authorization | payment attempts, authorization results, decline codes, payment status, latency |
| Inventory system | Tracks availability and reservations | SKU availability, stock changes, reservation status, location |
| Analytics platform | Consolidates data for reporting and monitoring | normalized events, funnels, KPI calculations, alerts |
| CDP | Resolves customer identity and supports segmentation | unified profiles, behavioral segments, cross-channel identifiers |
In the Dior Data Hub project, Computools developed a custom CMS to manage customer orders and product data and to collect sales statistics. The platform reduced checkout time and increased user throughput.
1. Modern commerce architecture
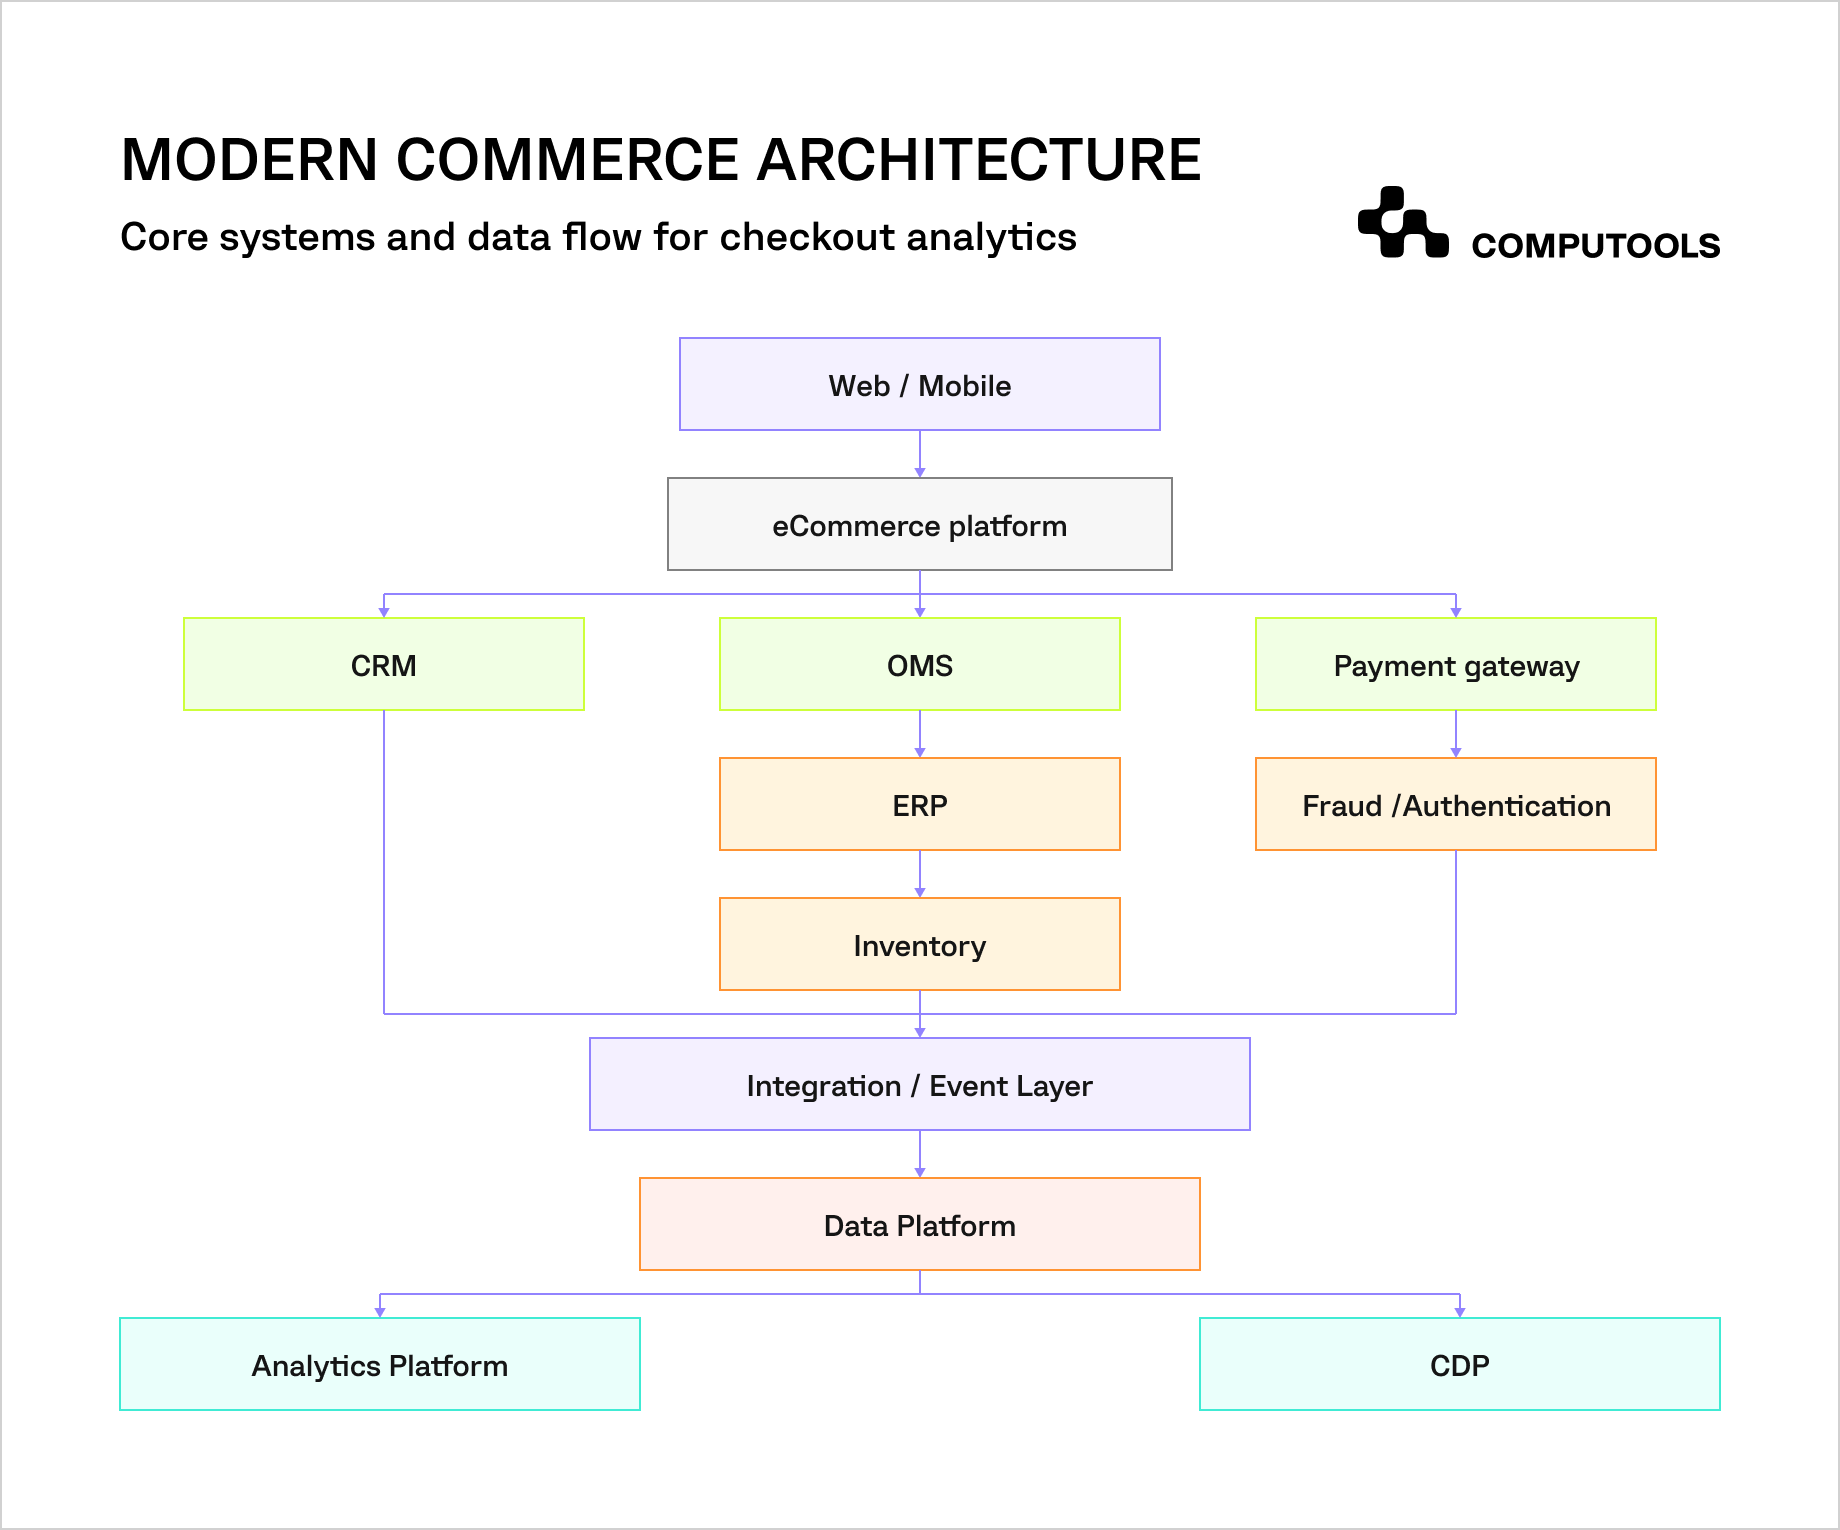
Figure 3. Modern commerce architecture for checkout data integration
2. Shared identifiers across the transaction
The architecture becomes usable for checkout analysis when the same transaction can be traced across systems.
A typical identifier chain includes: session ID → cart ID → payment attempt ID → order ID
The Customer ID can be added when the shopper is authenticated or resolved later via the CDP or CRM.
These identifiers should remain available in events, API messages, and analytical records. If the payment gateway uses one transaction reference, the OMS uses another, and the analytics platform cannot map the two, payment success and order completion cannot be reliably reconciled.
3. System ownership and data consistency
Each platform should remain authoritative for the records it creates.
The eCommerce platform owns checkout state and customer-facing events. The payment gateway owns authorization and transaction outcomes. The OMS owns the order status. Inventory systems own availability and reservation data. CRM and CDP records add customer context, while the analytics platform stores normalized copies for analysis.
Clear ownership reduces conflicting statuses across dashboards. It also makes reconciliation rules easier to define when two systems report different states for the same transaction.
4. Integration and event exchange
Commerce systems can exchange data through APIs, event streams, webhooks, or a combination of these mechanisms. The choice depends on transaction volume, latency requirements, platform capabilities, and the type of data being transferred.
Checkout-critical events should reach the analytical layer with enough detail to preserve sequence and context. Payment authorization, order creation, inventory reservation, and pricing changes should carry correlation identifiers and timestamps so teams can reconstruct the transaction without relying on manual matching.
For retailers operating across several sales and operational systems, retail software development services often include integration work across storefronts, order management, inventory, payments, and enterprise platforms. eCommerce software development services cover the customer-facing and transaction layers that feed the same architecture.
The integrated record should trace each transaction from customer action through payment and order processing.
Our e-commerce integration guide covers data synchronization across eCommerce platforms, CRM, ERP, payment gateways, and other connected business systems.

Launch your checkout optimization system in 1–3 months, not years, and give eCommerce teams the data to pinpoint payment drop-offs, reduce checkout friction, improve transaction success rates, and recover more revenue.
Which KPIs matter most
The most useful ecommerce checkout metrics show where customers drop off, how reliably payments are processed, how effectively failed transactions are recovered, and the financial impact of failures. Each metric needs a consistent event, denominator, and measurement window.
| KPI | What it measures | What to watch |
| Cart abandonment rate | Share of carts that do not result in a completed purchase | device, channel, cart value, promotion, customer segment |
| Checkout completion rate | Completed purchases as a share of checkout starts | stage-level drop-off, device, market, release |
| Payment success rate | Successful payment outcomes as a share of payment attempts | gateway, payment method, geography, currency, technical failures |
| Authorization rate | Authorized transactions as a share of valid authorization requests | issuer declines, authentication, provider, market |
| False decline rate | Estimated share of legitimate transactions rejected during payment processing or fraud screening | fraud rules, later successful attempts, manual review outcomes |
| Time to checkout | Time from checkout start to completed purchase | stage duration, API latency, authentication delays |
| Error rate | Share of relevant sessions or attempts affected by a defined error | error type, source system, release, browser, provider |
| Retry success rate | Share of failed payment flows recovered through a subsequent attempt | retry count, method or provider changes, final outcome |
| Revenue leakage | Transaction value lost through identifiable checkout, payment, or order-processing failures | failure category, recoverability, affected transaction value |
1. Conversion and checkout progression
Cart abandonment and checkout completion cover different stages of purchase intent. Cart abandonment includes customers who leave after creating or using a cart, while checkout completion starts once the customer enters the checkout flow.
Checkout completion rate = completed purchases / checkout starts
Stage-level progression helps narrow the source of deterioration. A decline before begin_checkout may be linked to cart value, inventory, pricing, or promotions. A decline later in the flow shifts the investigation toward shipping, payment, technical errors, or order processing. Time to checkout should be measured for the full flow and for individual stages. This makes delays in shipping calculations, authentication, inventory checks, payment processing, or order creation visible.
In the Dior Data Hub project, the platform reduced checkout time and increased user throughput.
2. Payment performance and recovery
The payment success rate and the authorization rate measure different points in the payment lifecycle.
Payment success rate = successful payment outcomes / payment attempts
Authorization rate = approved authorization requests / eligible authorization requests
The denominator for the authorization rate should follow one documented definition across reports. Duplicate attempts, technical requests that never reached authorization, and repeated retries can otherwise distort the result.
False declines need a defined estimation method because merchants cannot directly confirm the legitimacy of every rejected transaction. Useful evidence includes a later successful payment for the same cart, a successful switch to another payment method, and manual review or fraud-model outcomes.
Retry success should be measured against the original failed payment flow. Linking attempts via a common transaction or payment identifier shows how many failures were recovered and which methods, providers, or authentication paths led to the recovery.
3. Errors and revenue leakage
Error rate should be segmented by checkout stage, source system, release, device, browser, and provider. The aggregate rate signals deterioration; the underlying error categories identify where the failure occurred.
Revenue leakage connects those failures to transaction value.
Relevant categories may include:
- technical payment failures;
- authorized payments without valid orders;
- unrecovered retryable failures;
- pricing or inventory failures;
- order-processing errors.
The value should be tracked by failure category and recovery status. This gives teams a financial basis for prioritizing checkout and payment changes.
For larger retail environments, our article on the cost of a marketplace data platform for retail explains the infrastructure behind ingestion, transformation, storage, monitoring, and analytics at scale.
AI & Behavioral Analytics
Behavioral analytics adds a customer-interaction layer to checkout data. It shows how users move through the interface, where they hesitate, which actions repeat, and what happens immediately before abandonment or a failed transaction.
1. Behavioral signals across the checkout journey
Three tools are especially useful for diagnosing customer behavior during checkout:
- Session replay reconstructs individual sessions and shows repeated clicks, form hesitation, navigation problems, validation issues, and failed interactions.
- Heatmaps aggregate clicks, scrolling, and attention patterns across many sessions, making it easier to identify elements customers overlook or interact with unexpectedly.
- Funnel analytics measures progression between checkout stages and shows where conversion changes across devices, browsers, markets, and customer segments.
These signals become more useful when sessions are filtered by a defined outcome. Examples include customers who abandoned after shipping costs were revealed, changed payment methods, submitted payment multiple times, or encountered repeated validation errors.
2. AI-based detection and prediction
AI can extend this analysis across larger datasets and more combinations of variables.
- Anomaly detection can flag unusual changes in authorization rate, payment success, error frequency, latency, or stage conversion across payment methods, devices, geographies, and releases.
- Behavioral segmentation groups users by recurring patterns such as repeated retries, payment-method switching, long checkout duration, or high-value abandonment.
- Predictive churn estimates the likelihood that an identified customer will disengage after a poor checkout experience, provided enough historical purchase and interaction data is available.
These capabilities can be built into AI development services once event tracking, transaction linking, and historical data are reliable enough for model training and validation.
Our guide to building a real-time fraud detection platform covers how behavioral, device, session, payment, and transaction signals can support anomaly detection and real-time risk decisions.
3. Behavioral and transactional data in one analysis
Behavioral data records what the customer did in the interface. Transactional data records how commerce, payment, and order systems responded.
A session replay may show that a customer clicked the payment button three times. Payment events can identify the result of each attempt: authentication failure, issuer decline, gateway error, or successful authorization. Order events, then confirm whether the authorized transaction produced a valid order.
Combined predictive analysis gives teams enough context to separate customer behavior from payment and operational failures and identify the part of the checkout flow that needs attention.
Best practices before optimizing payments
Payment optimization should start with a verified baseline. Teams need consistent transaction data, reliable event tracking, connected commerce systems, and continuous payment monitoring before changing the checkout experience or adding new payment methods.
1. Establish one checkout data model
Use the same definitions for sessions, carts, payment attempts, orders, failures, and completed purchases across analytics and operational systems. Shared identifiers should connect customer actions with payment and order outcomes. The model should also define ownership for each data source. Payment status comes from the payment provider, order status from the OMS, inventory state from the inventory system, and customer-facing events from the commerce platform.
For complex commerce environments, eCommerce software development services can cover the application, integration, and data layers involved in maintaining that transaction flow.
2. Validate tracking before trusting the funnel
Event tracking should be tested against real checkout scenarios before teams use it to prioritize optimization.
Validation should cover:
- successful purchase;
- cart or pricing change;
- shipping failure;
- validation error;
- payment decline;
- authentication failure;
- payment retry;
- order creation failure.
The same event definitions should work across channels. For mobile app development, this includes app versions, operating systems, payment SDK behavior, and mobile-specific checkout events. For web development services, teams should also verify browser events, frontend errors, failed requests, and release-level changes.
3. Connect data across commerce systems
Checkout analysis breaks down when payment, order, inventory, and customer data cannot be matched to the same transaction.
Integration rules should preserve session ID, cart ID, payment attempt ID, and order ID across APIs, events, webhooks, and analytical records. Reconciliation should also identify inconsistent states, such as an authorized payment with no corresponding order or an order with an unresolved payment status
This work often falls within broader software engineering services because the problem spans application logic, integrations, data contracts, and operational monitoring.
4. Monitor payment health continuously
Payment performance should be monitored by gateway, payment method, geography, currency, device, and release where the data supports that level of segmentation.
The core monitoring set should include:
- authorization rate;
- payment success rate;
- decline distribution;
- authentication failures;
- gateway and processor errors;
- payment latency;
- retry success;
- payment-to-order reconciliation.
Thresholds should be based on historical performance for each segment. A stable overall payment success rate can still mask deterioration in a single market, provider, or payment method.
5. Test the identified problem before redesigning checkout
Changes should start from a specific failure pattern and a measurable hypothesis.
If drop-off increases after shipping calculation, investigate pricing and delivery conditions. If authorization deteriorates for one payment method, inspect the issuer, authentication, gateway, and routing data. If one browser shows a higher technical error rate, fix the implementation before changing the full checkout design.
The baseline established before the change should remain unchanged during evaluation. This makes it possible to compare conversion, payment health, error rates, checkout duration, and revenue impact against the same definitions used to identify the problem.
Dior Data Hub: reducing checkout time and support workload
For Dior Data Hub, Computools developed a custom CMS to streamline e-commerce order processing and support higher transaction volumes. The platform reduced checkout time, increased user throughput and average order value, and reduced the monthly support system workload.
Across 40+ retail software projects, Computools has delivered custom solutions across fashion, grocery, and eCommerce worldwide.
Computools
Software Solutions
Computools is an IT consulting and software development company that delivers innovative solutions to help businesses unlock tomorrow.