THE AUTHOR:

Wind operators are scaling into a much harder asset management environment. GWEC reports that global installed wind power reached 1,299 GW in 2025, with a record 165 GW of new capacity added and 28,395 turbines installed across 57 countries. In Europe alone, WindEurope reports 304 GW of existing wind capacity and expects another 151 GW to be installed during 2026–2030. The IEA also forecasts 732 GW of cumulative onshore wind additions over 2025–2030.
This growth increases the need to build a wind turbine monitoring system that can support larger fleets, mixed turbine models, remote sites, higher data volumes, and faster maintenance decisions. Standard dashboards are often too narrow for this because they rarely connect a wind turbine telemetry system, inspection reports, work orders, spare parts, weather inputs, asset history, and financial impact in one operating layer.
The biggest technical barriers are already visible across the industry: low data processing efficiency, lack of standardization, low trust in data models, unplanned maintenance, and complex relationships between OEMs, developers, and asset owners. For engineering leaders, this means source-of-truth conflicts, incompatible data formats, weak API coverage, fragmented SCADA and CMMS integrations, and unreliable alert logic. For operations leaders, it means delayed fault response, unclear maintenance priority, poor visibility into downtime drivers, and limited ability to compare turbine performance across sites.
This article explains how to build an IoT wind turbine monitoring system for real-time asset tracking, with a focus on product requirements, software architecture, data pipelines, edge processing, integrations, predictive analytics, security, and operational scalability.
As wind capacity grows and operators manage larger, more distributed fleets, choosing the right technology partner becomes part of the monitoring strategy. For more context, read Computools’ overview of top energy software development companies.
How to build a wind turbine monitoring system using IoT: Computools case
A relevant example is a Drone Analytics platform for a global wind energy company that manufactures, installs, and maintains wind turbines across international markets. The client needed a better way to manage turbine inspection data because reports were stored in different places, delivered in different formats, and required manual analysis.
Computools developed an IoT-based management system that centralized Critical Inspection Reports and Basic Inspection Reports in one platform. The system processed inspection data, extracted key details from JSON and PDF reports, identified blade damage categories and assessment statuses, and used business rules to prioritize maintenance tasks.
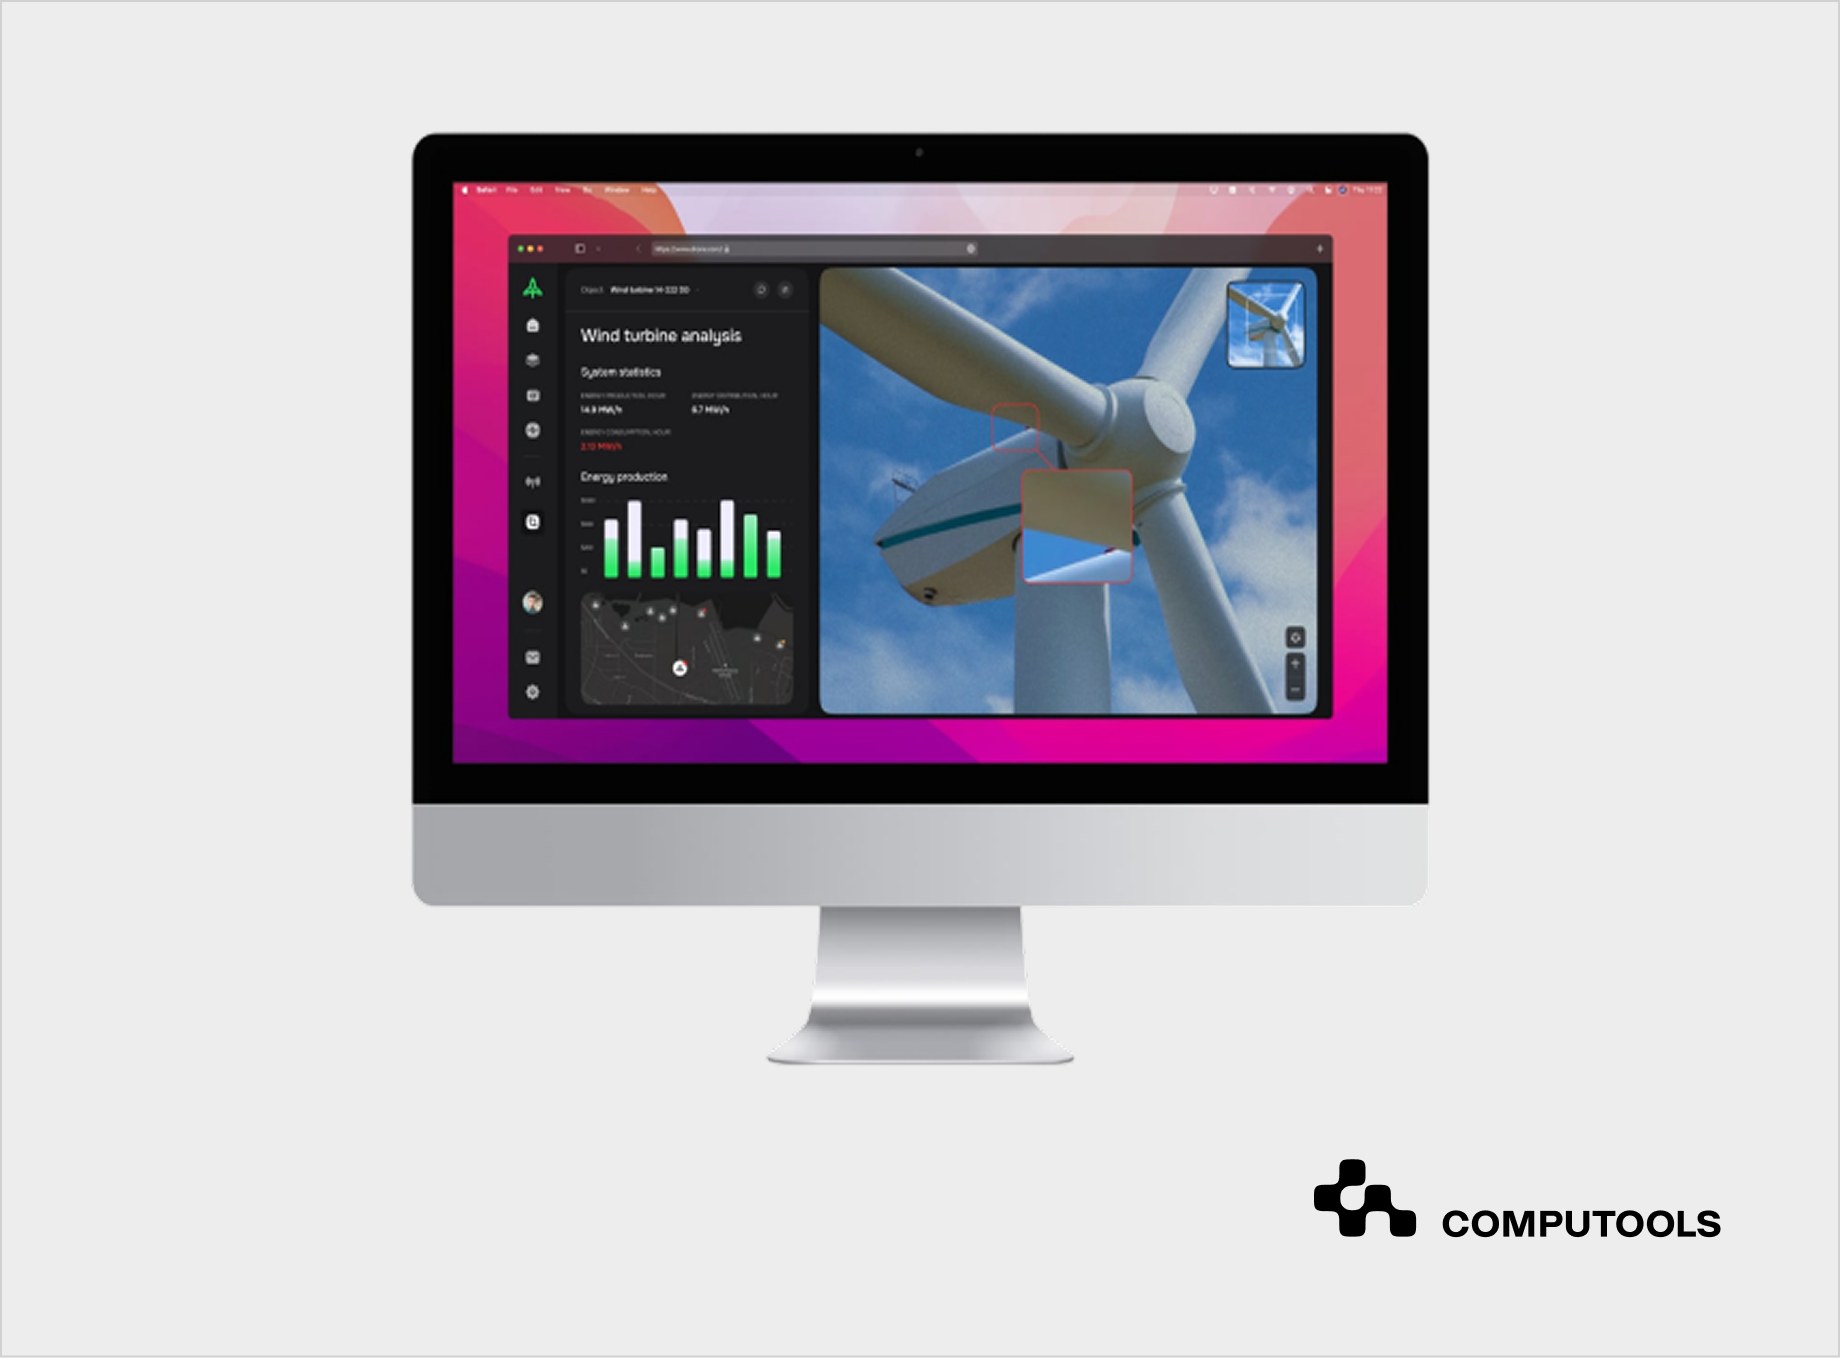
The platform was designed as a practical operating tool rather than a simple report repository. It connected inspection data with wind turbine health control, maintenance planning, and asset performance management. Teams could access inspection records faster and turbine conditions more consistently, as well as reduce manual work in turbine data analytics and report processing.
The technical setup included Java, JSON, Gson, MSSQL DB, a business logic module, and caching to support performance. This made the platform suitable for structured data processing, report parsing, centralized storage, and fast access to turbine inspection information.
The project improved how the client managed its wind turbine fleet. Real-time sensor data contributed to a 5% increase in mean time between failures, reduced operational costs, lowered the need for manual involvement, and increased safety by reducing high-altitude work. The system also supported higher annual electricity generation and stronger revenue from electricity sales.
In monitoring wind turbines, this example illustrates the integration of inspection data, signals from IoT, business rules, and asset records in a unified system. The same concept can be applied on a larger scale in a variety of fields, such as real-time asset tracking, predictive maintenance, field service operations, and executive performance dashboards.
As inspection reports become part of turbine health, maintenance planning, and asset performance management, operators need a structured way to store and process drone data.
For a closer look at this workflow, read Computools’ guide on how to build a drone data management system for wind turbine inspections.
How to build a wind turbine monitoring system step-by-step
Creating wind turbine monitoring systems using IoT involves a few considerations like architecture, asset structure, data, and operational fit. Being able to connect turbine data to real-time asset tracking, alerts, inspections, and maintenance along with executive dashboards drives value to the platform.
1. Start With the Operating Model, Not the Dashboard
The first step is to visualize how the system will alter day-to-day processes. The dashboard should provide decisions, escalation, and workflow paths, instead of presenting every possible metric.
Control room staff require real-time data on turbine status and output along with alarm generation. Maintenance planners require prioritized work orders, risk assessment of turbine components, and service history. Field technicians need mobile access to asset details, checklists, and inspection records. Executives need operational risk, downtime, production impact, and investment priorities.
In the Drone Analytics case, the client involved the company owner, product coordinator, subject matter expert, technical lead, and SRE team in the selection process. This is a useful model for wind monitoring projects because the system affects business goals, engineering decisions, site operations, and long-term asset reliability.
The operating model should answer:
• Which decisions should the platform support?
• Which workflows need real-time data?
• Which failures need immediate escalation?
• Which asset events should create work orders?
• Which metrics belong in executive reporting?
• Which processes stay manual during the first rollout?
A monitoring platform should be designed around operational decisions, not data visualization alone.
2. Define the Asset Hierarchy and Data Model
The asset model defines dashboards, analytics, maintenance, warranty history, and reporting frameworks. An unstructured model results in difficulties if teams need a failure, turbine, or lifecycle cost comparison.
A practical hierarchy should include:
• Wind farm
• Site
• Turbine
• Tower
• Nacelle
• Rotor
• Blades
• Gearbox
• Generator
• Pitch system
• Yaw system
• Converter
• Sensors
• Inspection records
• Maintenance events
• Spare parts
• Work orders.
In Drone Analytics, inspection reports had to be connected with turbine condition and blade damage categories. This shows why inspection data should sit inside the asset model instead of being stored as disconnected files.
All sensor data, inspection photos, faults, and maintenance activities must reference an asset or component. A disturbance should relate to a gearbox, bearing, generator, etc., and should not be a turbine-wide alert.
This design enables prediction and prevention of maintenance, as well as root cause analysis, and supports planning, warranty, and wind turbine asset tracking across multiple locations.
3. Map Data Sources and Integration Requirements
A wind turbine monitoring system should work inside the existing operational and enterprise environment. Treating it as a separate tool creates data silos and manual re-entry.
Core data sources may include:
• SCADA
• PLCs and turbine controllers
• Condition monitoring sensors
• Weather stations
• Power meters
• Drone inspection systems
• Thermal imaging tools
• Field technician apps
• CMMS
• ERP
• GIS
• EAM
• BI platforms
• Data warehouses
Define which systems are sources of truth and which systems consume processed data. SCADA may provide turbine operations data, CMMS may manage work orders, ERP may store costs and inventory, and GIS may provide location context.
The Computools case involved inspection reports in JSON and PDF formats, stored across different locations. This is a common integration issue in wind operations. The platform must collect structured and unstructured data, normalize it, and make it usable for maintenance and performance analysis.
Engineering teams should clarify:
• Which data needs real-time streaming?
• Which data can sync in batches?
• Which events trigger alerts?
• Which events create maintenance tasks?
• Which APIs are available?
• Which systems need custom connectors?
• Which formats need normalization?
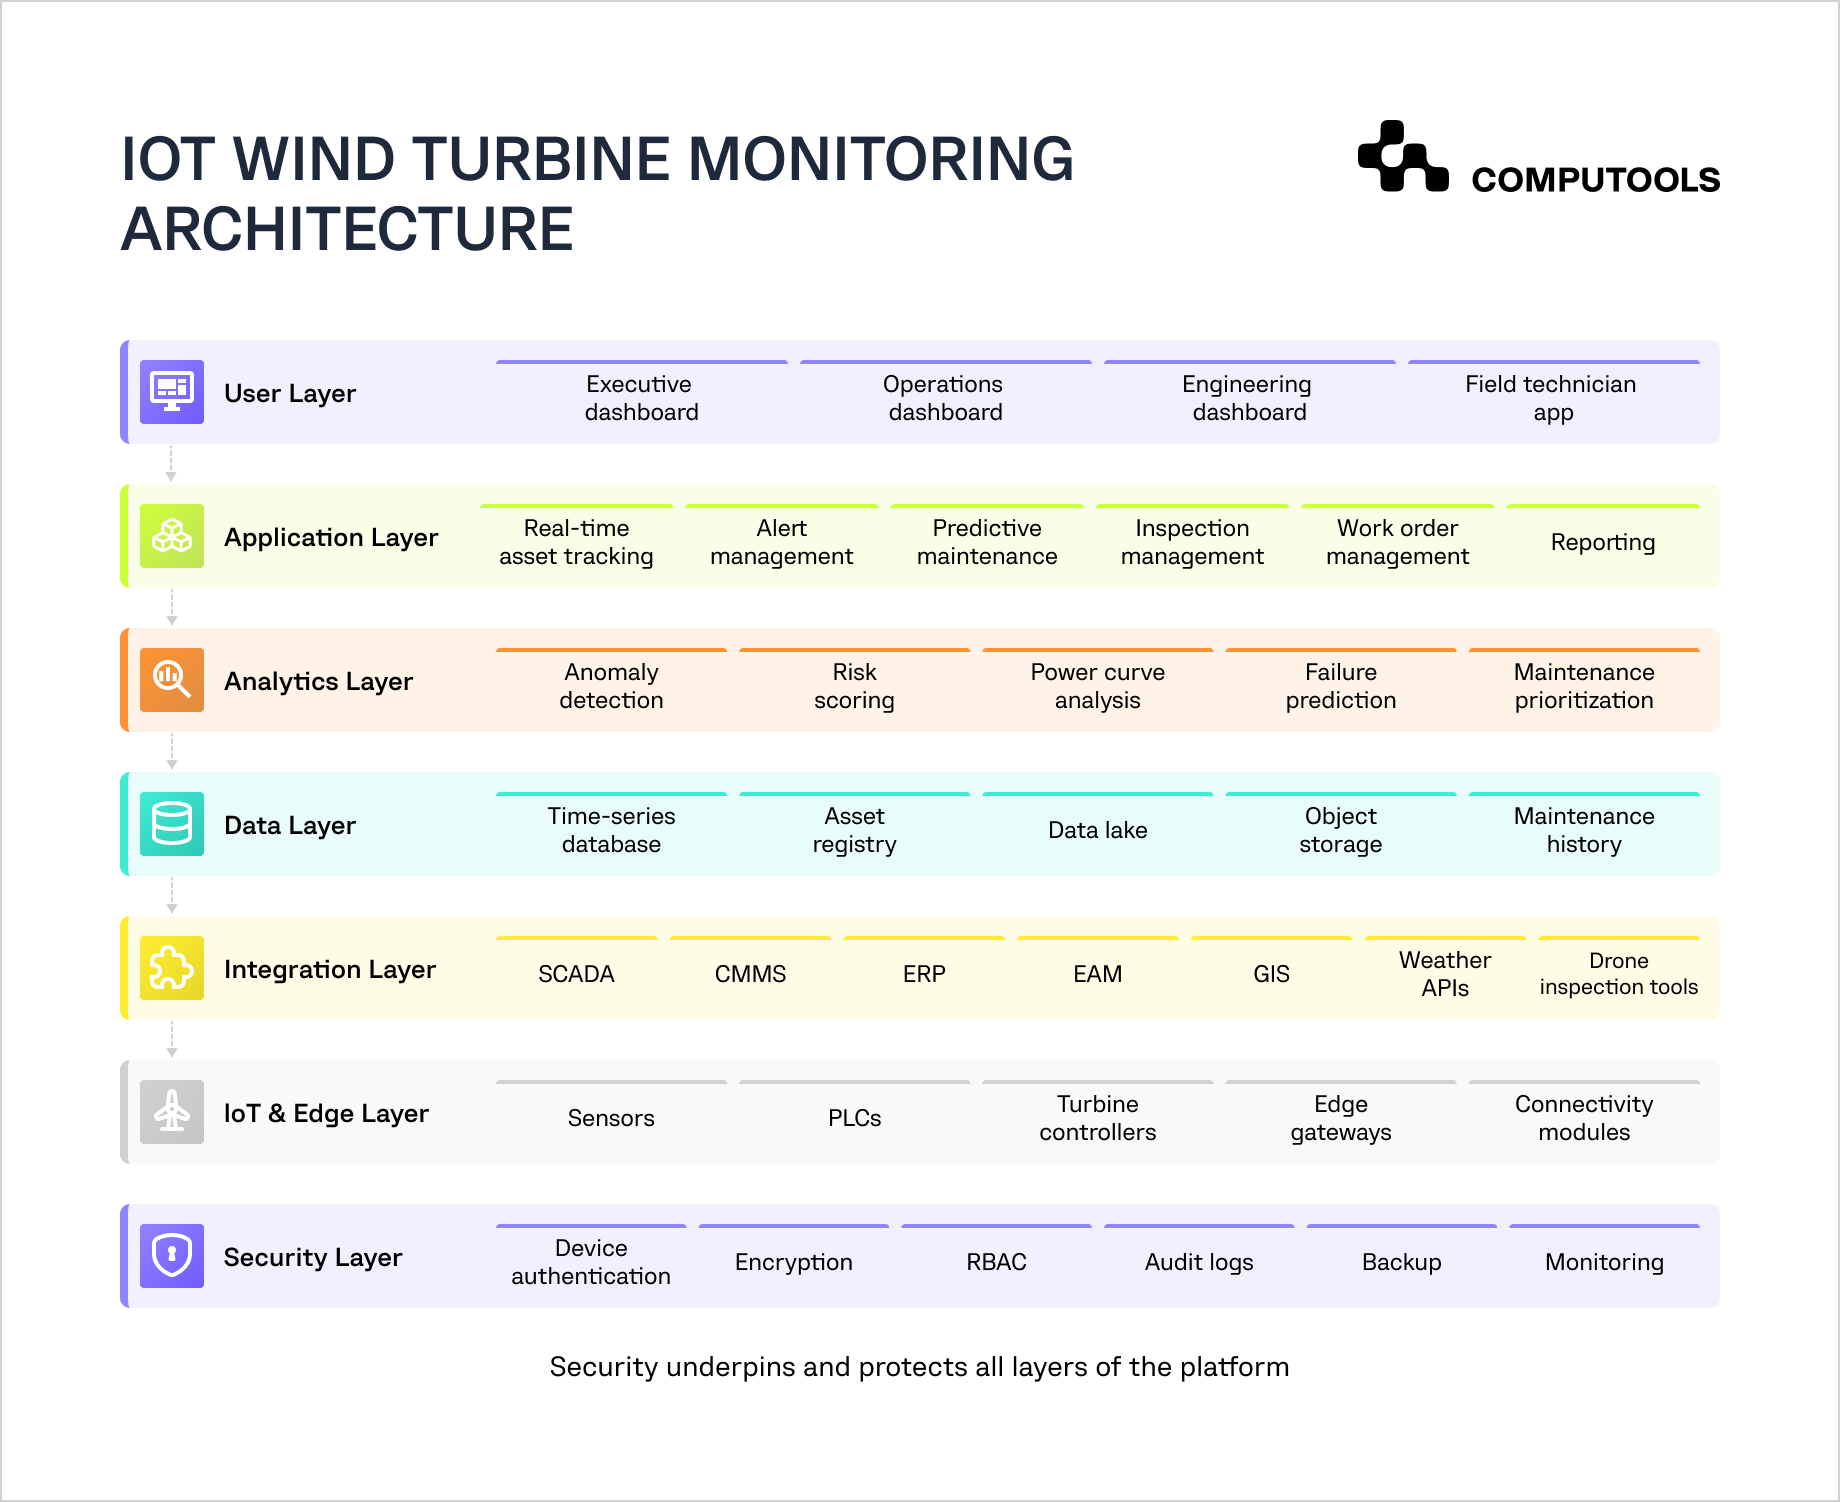
4. Design the IoT Architecture
The architecture should support field data collection, real-time wind turbine monitoring, historical analytics, enterprise integrations, and secure access.
For industrial IoT for wind energy, a strong architecture usually includes:
• Sensor and device layer
• Edge processing layer
• Connectivity layer
• Data ingestion layer
• Stream processing layer
• Storage layer
• Analytics layer
• Application layer
• Integration layer
• Security and monitoring layer.
The Drone Analytics platform was built using Java, JSON, Gson, MSSQL DB, with a business logic and caching module. This design enabled the structured storage of data, rapid access to inspection details, and the execution of business rules for the parsing of reports.
Key decisions include deployment model, edge processing scope, data retention, event processing, alerting logic, API strategy, storage architecture, and integration with SCADA, CMMS, ERP, and other systems.
For operators with several wind farms, multi-site scalability should be part of the first architecture discussion. The wind farm monitoring system may start with one site, but it should support future rollout across regions, turbine models, vendors, and operating teams.
5. Build the Edge Layer for Real Wind Farm Conditions
Wind farms often operate in remote areas with unstable connectivity, latency, and bandwidth limits. The edge layer keeps the remote wind turbine monitoring reliable in these conditions.
The edge layer should support:
• Local data collection
• Data filtering
• Temporary buffering
• SCADA for wind farms
• Local rule execution
• Device health monitoring
• Secure authentication
• Offline operation
• Data synchronization after connection recovery
• Firmware update management.
For high-frequency vibration data, the edge gateway processes patterns that are abnormal and compresses summaries to send only relevant events to the cloud. This greatly reduces data transfer costs and improves the overall system response time. Edge processing also helps urgent events move faster. If a critical value crosses a defined threshold, the system can trigger a local response without waiting for cloud processing.
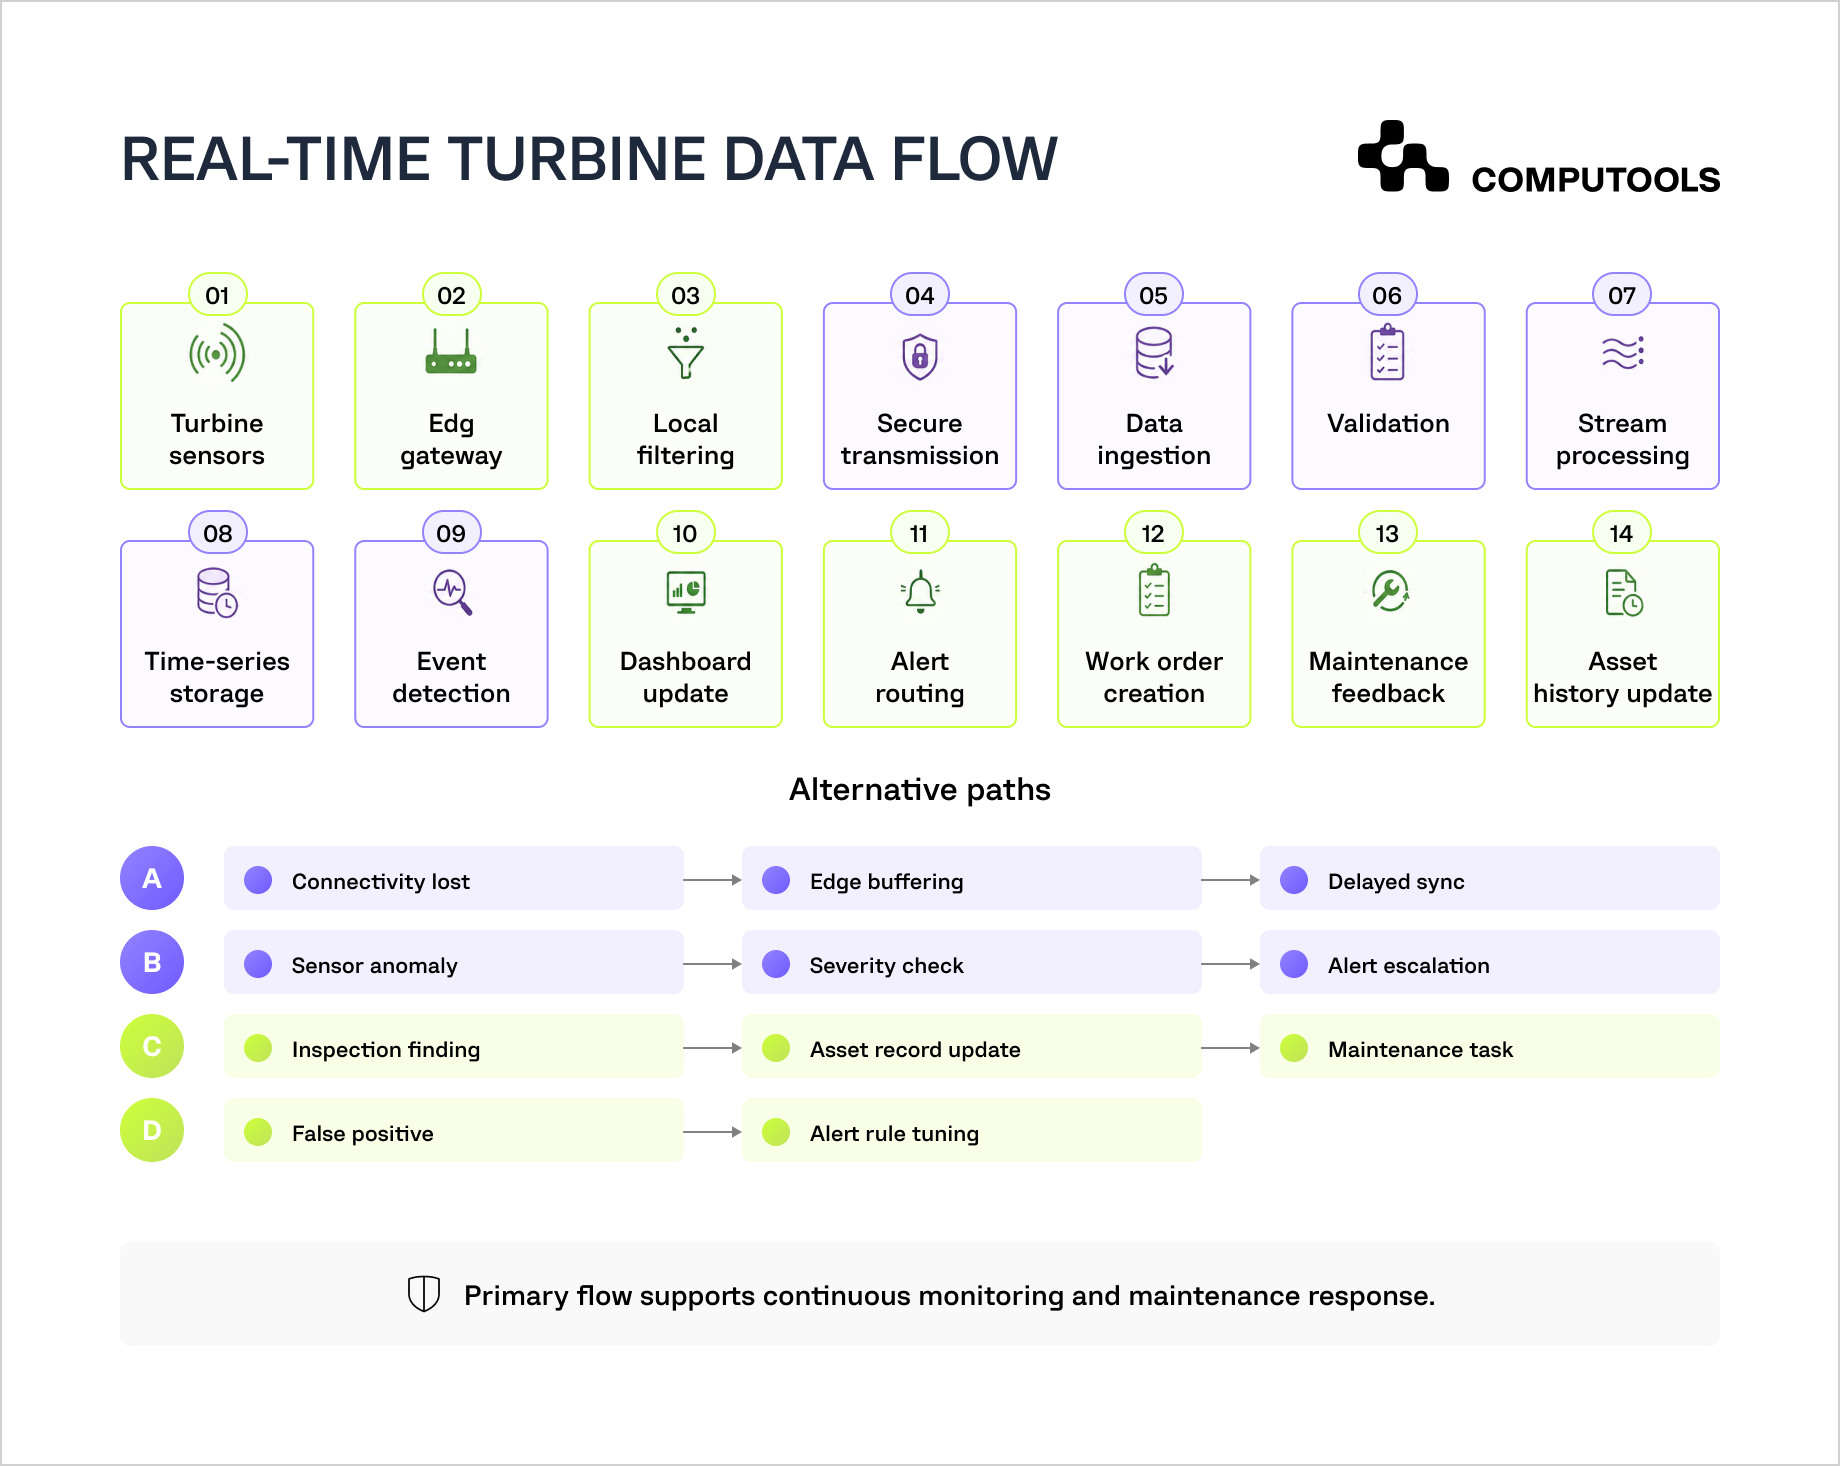
6. Create a Reliable Data Pipeline
The system requires a solid data pipeline. Sensor data, SCADA data, inspection files, and maintenance records all need a defined pathway to be useful for dashboards, alerts, or analytics.
A reliable pipeline should include:
• Data ingestion
• Validation
• Cleansing
• Normalization
• Enrichment
• Time stamping
• Stream processing
• Event detection
• Storage
• API delivery
• Dashboard updates
• Alert triggering.
The Drone Analytics project shows the value of automated data extraction. The platform extracted key details from inspection reports, including blade damage categories and assessment statuses. This reduced manual analysis and made inspection data easier to use for maintenance planning.
Data engineering teams must construct a data pipeline that manages bad data, removes duplicates, scales values for different turbine models, aligns time inputs, partitions significant events from unprocessed telemetry data, and manages the asset-component relationship.
This data pipeline builds the framework needed to create datasets for predictive analytics and models. These predictive models utilize the information and explain the history of failure of the sensors, the results of inspections, as well as the maintenance history and outcomes.
For related guidance on connecting asset data with performance, efficiency, and sustainability goals, read Computools’ article on how to build an energy optimization system for sustainable operations.
7. Choose the Right Storage Architecture
Wind turbine monitoring platforms process several data types, so one database is rarely enough.
A practical setup may include:
• Time-series database for sensor readings.
• Relational database for assets, users, roles, and workflows.
• Object storage for inspection files, images, videos, and reports.
• Data lake for historical analytics and model training.
• Cache layer for real-time dashboard performance.
Each storage type should match how the data is used. High-frequency telemetry needs fast time-based queries. Asset profiles and permissions need structured storage. Drone images and thermal files need scalable object storage. Historical analytics and AI training need a data lake.
8. Build Real-Time Asset Tracking Logic
Real-time IoT asset tracking for wind turbines should combine asset status, operational state, location, production data, alerts, maintenance context, and inspection history.
Core tracking views may include:
• Wind farm map
• Turbine status board
• Component health view
• Alarm priority list
• Maintenance risk queue
• Production performance view
• Field team task view
• Executive asset performance view.
In Drone Analytics, our team focused on turbine inspection data, but the same tracking logic can extend to live asset condition. A turbine profile should show current operating status, inspection history, detected blade damage, open tasks, sensor trends, and maintenance priority.
Asset statuses should support quick action. Common statuses include running, idle, under maintenance, fault detected, communication lost, inspection required, high-risk component, and weather-related restriction.
The tracking logic should also connect operations with the business context. An underperforming turbine should show current output, expected output, fault history, open work orders, recent inspections, and estimated production impact.
9. Design Alerting Without Creating Alarm Fatigue
Alert quality matters more than alert volume. Too many low-value alerts slow response and reduce trust in the system.
Alerting logic should include:
• Threshold-based alerts
• Rule-based alerts
• Pattern-based anomaly detection
• Severity levels
• Escalation paths
• Alert grouping
• Duplicate suppression
• Maintenance ticket creation
• Notification routing by role
• Alert acknowledgment tracking.
In the Drone Analytics solution, we included a business logic module that used rules to prioritize maintenance tasks. This is a practical approach for alert design. The system should combine signals before escalating certain events. A short temperature spike may only need logging. A temperature spike combined with vibration growth and power output drop should trigger a higher-priority investigation.
Alert rules should improve through technician feedback. Repeated low-value alerts should lead to adjusted thresholds, severity, or correlation logic.
10. Connect Monitoring With Maintenance Workflows
Real-time monitoring creates value when detected issues move into maintenance execution without manual re-entry.
The platform should support:
• Work order creation
• Task prioritization
• Technician assignment
• Maintenance checklists
• Mobile access for field teams
• Spare parts visibility
• Repair notes
• Photo uploads
• Completion status
• Asset history updates.
Common integration targets include CMMS, ERP, EAM, inventory systems, and field service management tools.
For example, when the system detects a high-risk gearbox pattern, it should create or recommend a task, attach relevant sensor trends, show the affected component, display service history, and update the asset record after repair.
11. Add Predictive Analytics After the Data Foundation Is Stable
Predictive maintenance for wind turbines should come after reliable data collection, clean asset history, stable alerts, and validated maintenance records.
Useful predictive maintenance cases include:
• Gearbox failure risk
• Bearing wear detection
• Generator overheating patterns
• Blade damage detection
• Power curve deviation
• Repeated minor fault clustering
• Remaining useful life estimation
• Maintenance priority scoring.
Model inputs may include historical sensor data, SCADA events, weather data, maintenance history, inspection reports, failure records, component age, and operational load.
A phased approach works best. Start with rules and anomaly detection, then add risk scoring and predictive models once the platform has enough clean and validated data.
12. Include Drone and Visual Inspection Data in the Asset Record
Drone and visual inspection data should sit inside the same asset environment as sensor data and maintenance history, especially for blades and external components.
The system should support:
• Drone image uploads
• Thermal images
• Blade inspection files
• Damage classification
• Technician comments
• Repair recommendations
• Before-and-after repair records
• Linkage to turbine and blade IDs.
This is a relevant Computools angle because the company has experience with drone analytics for wind turbine inspection data. That experience can be connected with IoT monitoring, real-time asset tracking, predictive maintenance, and maintenance workflow automation.
13. Build Dashboards by Role
Having one dashboard for everyone creates too much noise. Employees in each role should only see relevant metrics, alerts, and workflows.
For engineering teams, dashboard metrics could include wind turbine sensor monitoring, sensor status and data quality, as well as alert logic, processing errors, device failures, integration failures, and release monitoring.
For operations managers, pertinent metrics may include wind turbine performance monitoring, turbine availability and downtime, the maintenance backlog, production loss, and response time as well as site performance and cost metrics.
For finance, the dashboard view should tie together the performance of all assets and the associated revenue, operational risks, site-level profitability, investment focus, and the balance between short-term and long-term reliability.
14. Plan Security at Device, Network, Application, and Data Levels
The monitoring of wind turbines forms the last link in the chain that connects physical assets, cloud-based operational technologies, enterprise and business systems and their associated business data. Security should be extended to all layers.
Key requirements include:
• Secure device provisioning
• Device identity management
• Encrypted data transmission
• API security
• Role-based access control
• Multi-factor authentication
• Audit logs
• Network segmentation
• Backup and recovery
• Secure firmware updates
• Vulnerability monitoring
• Data access policies.
The security model should cover both IT and OT environments. The platform collects operational data, connects to enterprise systems, and gives multiple teams access to asset-level information. Clear access rules, monitoring, and audit trails reduce operational and cybersecurity risk.
15. Prepare the Platform for Multi-Site Scaling
A pilot may work with 10 turbines, but full deployment needs a stronger scaling model. The system should support more turbines, sites, integrations, users, and data volume.
Scaling requirements include:
• Multi-site asset hierarchy
• Tenant or site separation
• Configurable alert rules
• Device provisioning automation
• Data retention policies
• API rate management
• Standardized integration templates
• Centralized monitoring
• Regional compliance support
• Multi-language and multi-role support if needed.
The Drone Analytics project started with a pilot project that helped the client evaluate technical fit, team capabilities, and alignment with requirements. This is a practical rollout model for wind monitoring systems. Start with a controlled scope, prove data quality and workflow value, then expand into more turbines, sites, integrations, and predictive maintenance use cases.
Launch your wind turbine monitoring system within 1–3 months instead of years. Connect assets, automate monitoring, and build a foundation for next-generation renewable operations.
How Computools helps build a wind turbine monitoring system
Computools assists wind operators and utility and renewable energy companies, as well as OEMs and other businesses with heavy assets, in creating integrated monitoring systems that consolidate turbine data with inspection and maintenance records, alerts, and workflow systems.
With over 250 engineers, more than 400 custom software projects delivered globally, ISO 9001 and 27001 certifications, Computools has the resources and capability to develop complex energy software that requires secure architecture, reliable integrations, and scalable delivery.
1. Solve Data Fragmentation Across Wind Assets
Teams have to deal with fragmented data from various sources such as SCADA systems, sensors, digital inspections, CMMS, ERP and BI tools. This leads to conflicts concerning the single source of truth and delays the root cause analysis.
Computools provides the solution by using structured data models, integration architecture, and consolidated asset records. This approach can also be used to expand the energy software development services by enabling connections of turbine telemetry, inspection, maintenance, and performance data for each asset.
2. Turn Monitoring Data Into Maintenance Action
Companies primarily faced the issue of gaps between identified problems and the maintenance that is actually performed. Automated alerts fail to drive maintenance if the team is still required to manually interpret the data, create and assign the tasks, and update the respective records.
Computools business logic, workflow, and enterprise integration excels in this area. This applies to electric power software development projects where alerts, work orders, spare parts, and asset history need to work together. In a full monitoring platform, the same logic can route confirmed issues into work orders, technician tasks, spare parts planning, and asset history updates.
3. Build for Field Conditions and Engineering Control
Wind farms operate across remote locations, mixed connectivity environments, and different turbine models. Engineering teams need control over data flow, edge processing, device communication, storage, and platform performance.
Computools designs systems for real field conditions: remote sites, mixed connectivity, high-frequency telemetry, and different asset types. This experience is relevant beyond wind and can be applied to renewable energy asset tracking. Our company also supports oil and gas software development where uptime, safety, and operational continuity are critical.
4. Make Predictive Maintenance Practical
Predictive maintenance depends on clean data, connected asset history, and verified maintenance outcomes. Many operators have sensor data, but lack the structure needed to trust predictive models.
Computools builds the foundation first: asset hierarchy, report parsing, time-series storage, inspection data management, maintenance history, and integration with operational systems. After that, AI development can strengthen anomaly detection, risk scoring, power curve analysis, and failure prediction.
5. Web, Mobile, and Multi-Site Scaling
A smart wind turbine monitoring solution should serve several user groups: executives, asset managers, control room teams, engineers, and field technicians. Computools can combine web development services for operational dashboards with mobile app development services for technicians who need access to tasks, inspection data, checklists, and asset records in the field.
The platform can also be designed for multi-site scaling with configurable alerts, role-based access, standardized integration patterns, centralized reporting, and a flexible asset hierarchy. This helps operators start with a focused rollout and expand across more turbines, sites, and maintenance use cases without rebuilding the core system.
Final thoughts
Constructing a wind turbine monitoring system is about more than gathering turbine information. It involves the establishment of a robust operational interface within which the state of assets and the results of inspections, together with alerts, maintenance interventions, and performance indicators, are seamlessly integrated.
For engineering managers, this results in clearer information flows, improved integration, and better scalability of system design. For operations managers, this brings in improved responsiveness and prioritized maintenance with reduced system downtime. Decision makers see improved asset performance and operational safety, with a better understanding of the return on technology investments and their impact on the bottom line.
If your business needs to create a unified monitoring system that integrates turbine data, inspection data, maintenance solutions, and predictive AI analytics, reach out to Computools to plan the system architecture, specify a roadmap, and implementation approach.
Computools
Software Solutions
Computools is an IT consulting and software development company that delivers innovative solutions to help businesses unlock tomorrow.


