THE AUTHOR:

To build energy optimization software, companies need a platform that connects energy data with real operational decisions. It should collect data from meters, sensors, equipment, tariffs, production workflows, and operational systems, then turn it into alerts, forecasts, optimization rules, reports, and better resource planning.
The need for these systems is becoming more urgent as electricity demand continues to rise faster than overall energy demand. According to the IEA, global electricity demand grew by around 3% in 2025, while total global energy demand increased by 1.3%. The agency also forecasts that global electricity demand will grow by an average of 3.6% per year from 2026 to 2030, driven by industry, electric vehicles, air conditioning, data centers, and broader electrification.
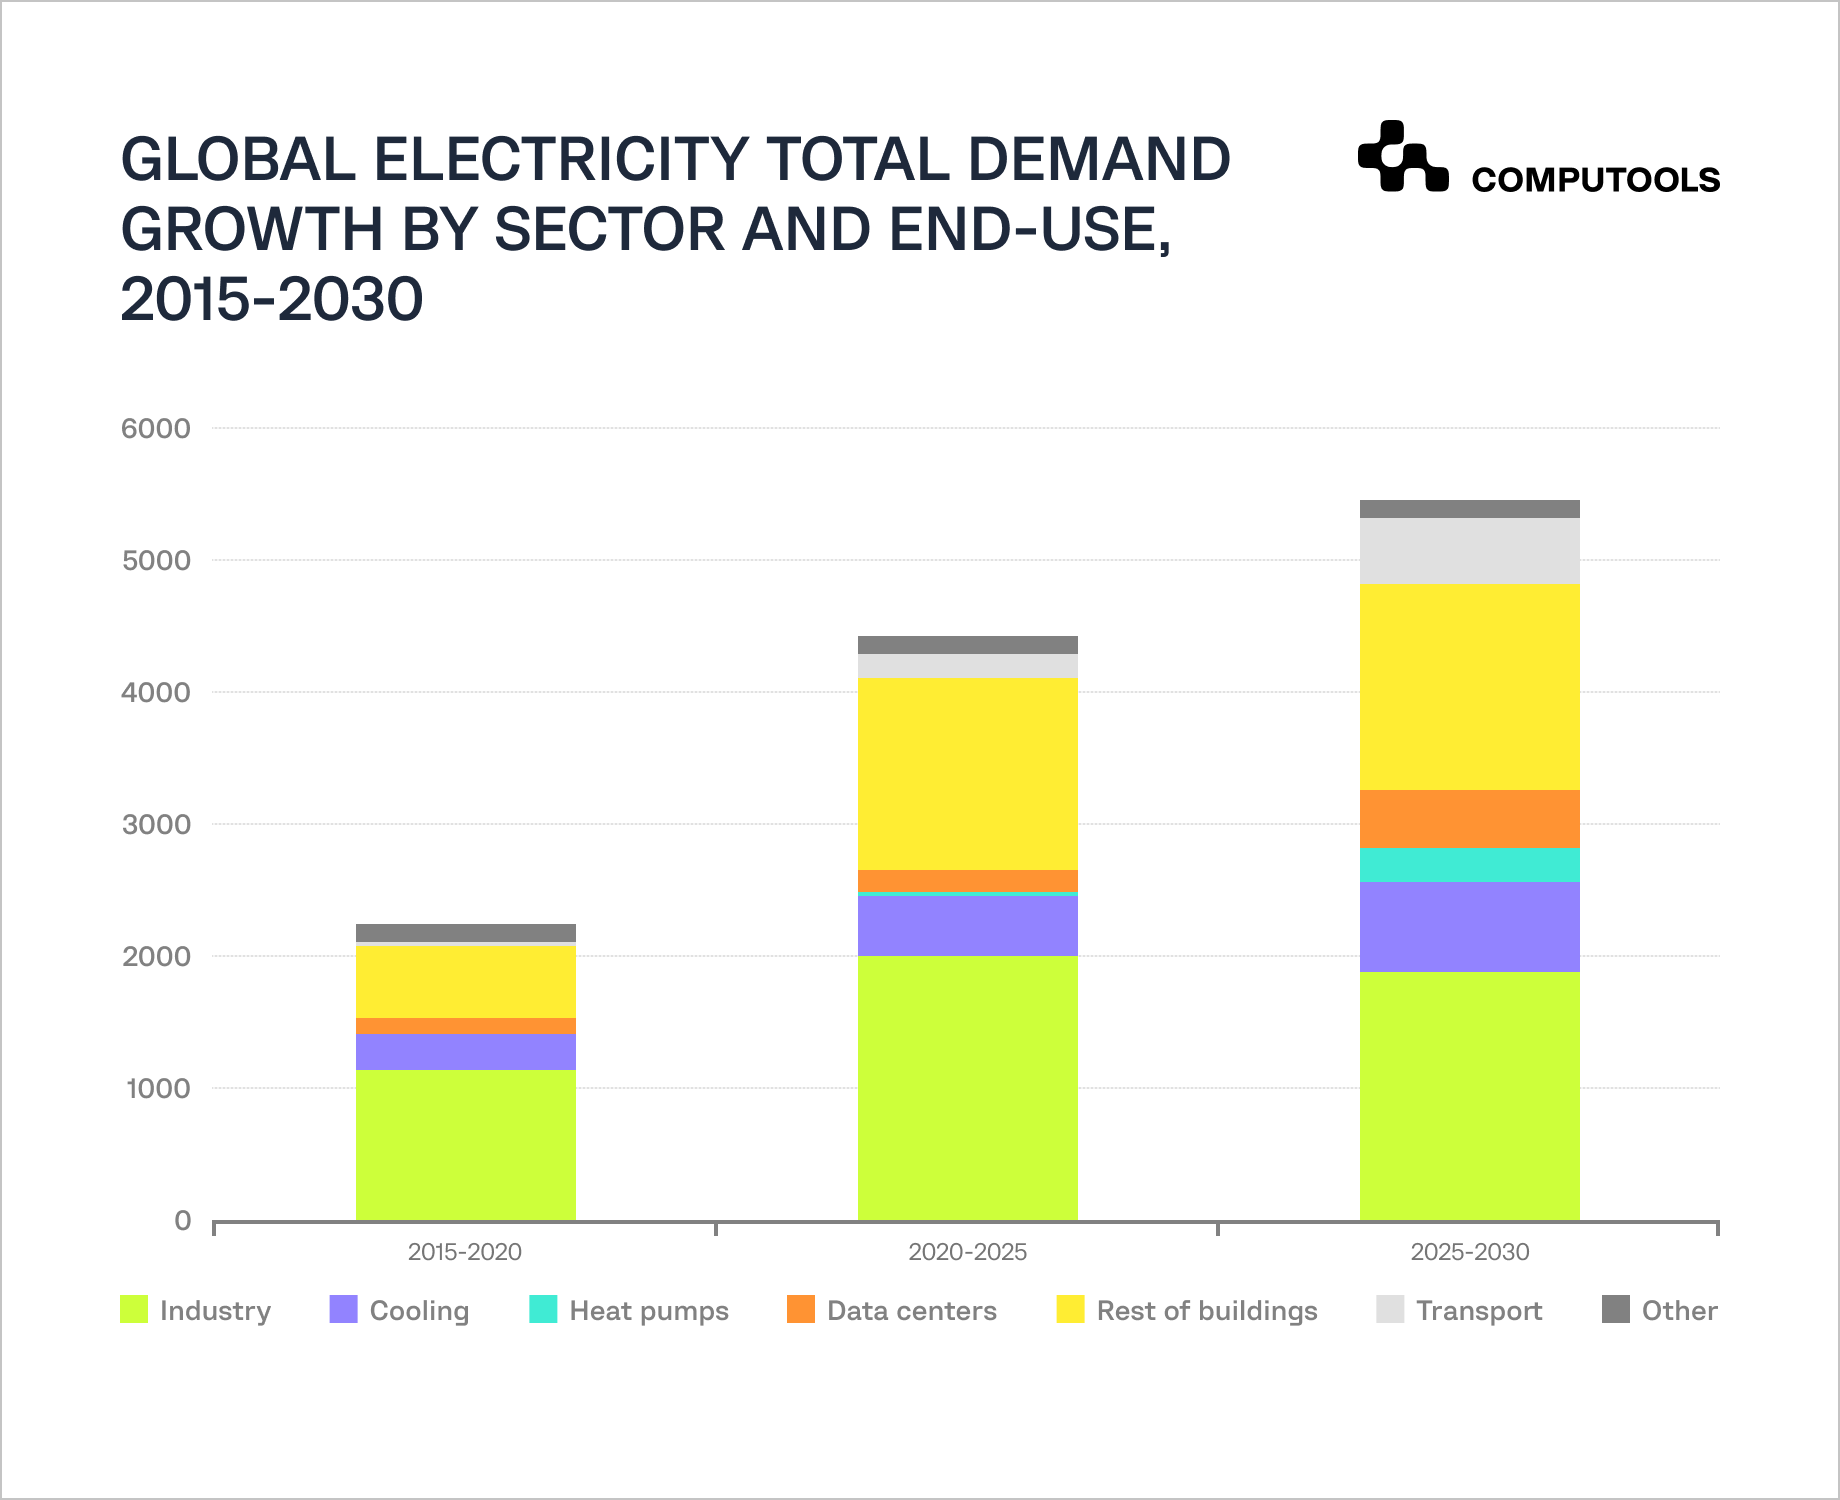
The IEA chart highlights the main drivers of additional electricity demand through 2030 and the need for better energy optimization.
At the same time, energy efficiency is still improving too slowly. The IEA estimates that global energy efficiency progress rose to 1.8% in 2025, compared with 1% in 2024, but remains below the pace needed to meet the global doubling target agreed at COP28. For energy companies, utilities, manufacturers, and large facility operators, this creates a clear business case for systems that integrate energy monitoring, forecasting, asset performance, and sustainability targets into a single operational workflow.
How Computools helped build energy optimization software for Winder
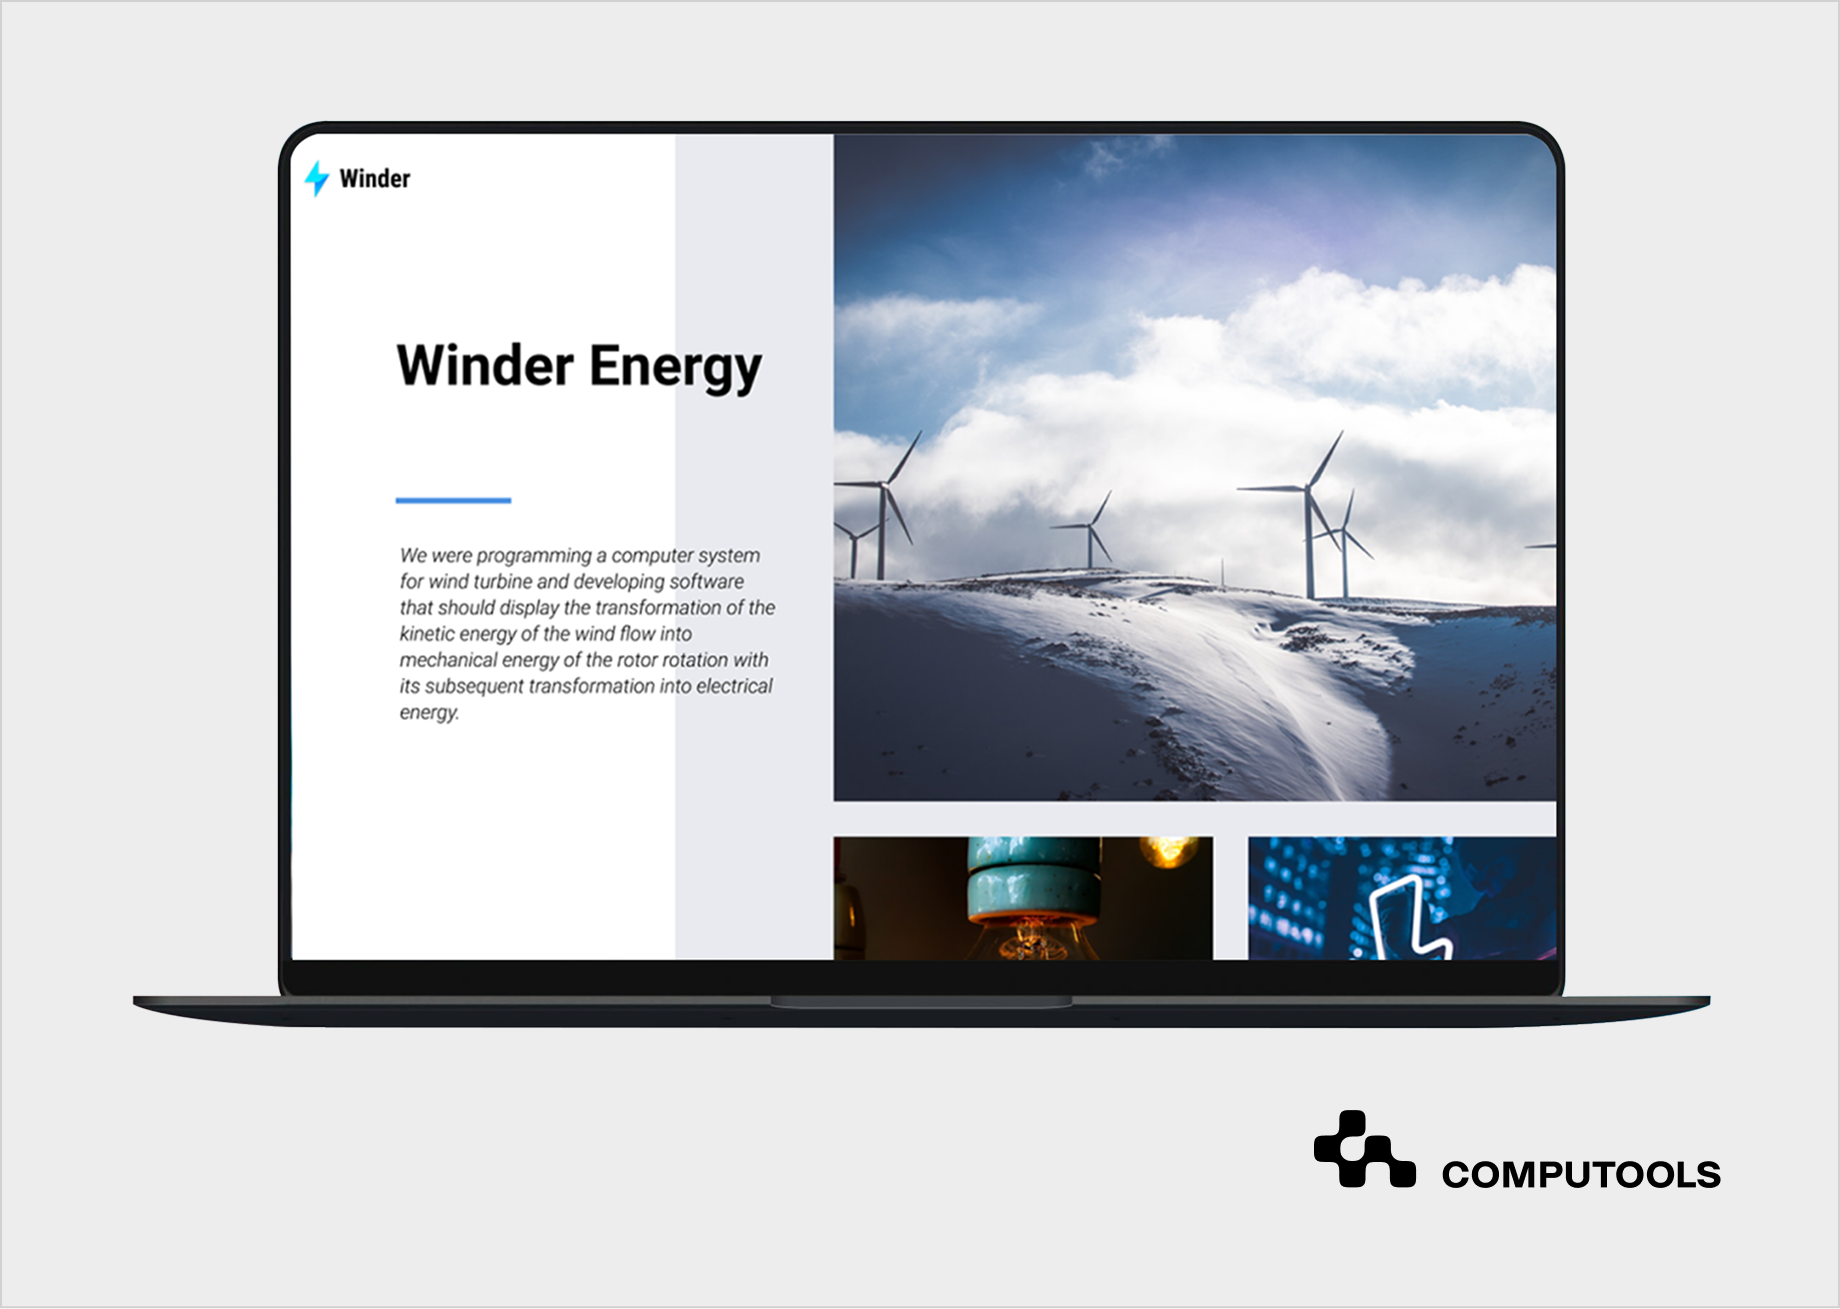
Winder is an energy company that designs and maintains systems to ensure the safety of critical facilities. The company operates globally and works in environments where security standards, accurate calculations, and fast response to operational risks are essential.
The client needed to improve the security and operational efficiency of large physical facilities. Its existing systems were complex, highly customized, and dependent on expert investigations because they could not perform real-time calculations. Another challenge was device connectivity: modern equipment had to exchange data within one network, while the system still had to remain reliable, secure, and suitable for critical infrastructure.
Computools approached the project with its expertise in energy software development services. The team began with discovery, expert consultations, and technical research to define how the system should process data from energy-related devices, support field communication, and handle complex calculations. This stage included the analysis of device API capabilities, communication logic, algorithm requirements, and user experience specifications.
The final solution was a customized system that integrates different devices, performs real-time calculations, and applies advanced algorithms for predictive analysis. It can help identify how devices should be placed and configured to improve safety, performance, and resource allocation across large facilities.
The project also relied on strong data engineering practices, as the system had to process both structured and unstructured data from multiple sources and make it usable for operational decision-making. Java, Golang, C++, PostgreSQL, MongoDB, Docker, and Kubernetes supported performance, scalability, data storage, and deployment stability. Angular was used for the front end, while Flutter was used for mobile access.
Predictive analysis was another important part of the solution. Through AI development, the system gained the ability to forecast events, support intelligent decision-making, and help teams respond to potential risks faster. As a result, Winder improved facility security, strengthened compliance with security standards, and made resource allocation more accurate and data-driven.
How to build an energy optimization system for sustainable operations in 10 steps
1. Audit current energy use and operational constraints
Every energy consumption optimization project starts with a reliable baseline. Before defining system features or selecting technologies, the company needs to understand how energy is consumed across facilities, assets, shifts, operating modes, tariff periods, and production cycles. This includes baseload consumption, peak demand, abnormal load patterns, idle-time waste, seasonal fluctuations, and asset-level energy intensity.
A qualified audit combines technical, operational, and financial data. Energy teams should review metering points, utility bills, equipment logs, sensor readings, maintenance records, production volumes, tariff schedules, environmental conditions, and manual reporting workflows. This makes it possible to identify whether changes in consumption are caused by equipment degradation, inefficient scheduling, process deviations, seasonal demand, incorrect configuration, or normal production activity.
The audit should document operational constraints in industrial and energy environments, where optimization rules must consider equipment limits, safety, uptime, dependencies, and compliance. Some assets can be rescheduled or adjusted, while others must operate within strict parameters like temperature, pressure, voltage, or security. Defining these limits early ensures future system recommendations are feasible and safe.
Key areas to assess include:
• current metering coverage and data quality;
• baseload and peak-load patterns;
• assets with the highest or most volatile energy demand;
• manual calculations and reporting gaps;
• existing monitoring, maintenance, production, and finance systems;
• tariff periods, demand charges, and cost drivers;
• safety, uptime, compliance, and process limitations;
• teams responsible for energy decisions and incident response.
For Winder, this step was especially important because the client operated large critical facilities where accurate calculations were essential to safety standards and operational response. Existing systems were complex, highly customized, and often required expert investigation because they could not perform real-time calculations. Before implementation, Computools analyzed the system context, device API capabilities, field communication strategies, and algorithm requirements. This helped define how energy-related devices had to exchange data, how calculations should work, and which operational scenarios the new system needed to support.
2. Define business goals and system requirements
After the audit, the company should translate energy issues into clear business goals and system requirements. At this stage, the team defines which problems the platform should solve, which users it should support, and how the business will measure the result after launch.
The goals may include reducing peak demand, lowering idle-time consumption, improving asset performance, automating reports, supporting emissions tracking, improving facility safety, or making resource allocation more accurate. Each goal should be connected to measurable KPIs, such as energy cost per facility, energy intensity per production unit, peak-load reduction, abnormal consumption events, response time, or avoided manual reporting hours.
In energy optimization system development, this step also defines the functional depth of the future platform. The team should decide whether the system will collect and visualize energy data, generate alerts, provide optimization recommendations, support predictive models, or integrate with operational systems that influence equipment schedules and energy use.
The requirements should cover:
• facilities, regions, and asset groups included in the first release;
• energy sources covered by the system;
• metering points, sensors, controllers, and operational systems to integrate;
• data update frequency for each source;
• user roles for energy managers, engineers, facility teams, executives, and administrators;
• alert logic, escalation paths, and approval workflows;
• dashboards, reports, and export formats;
• cybersecurity, access control, and audit trail requirements;
• scalability needs for future sites, devices, users, and analytics modules.
This is also the point where the company should choose between an off-the-shelf EMS and a custom platform. Ready-made systems can work for standard monitoring and reporting needs. Custom software engineering is usually more suitable when the company has complex infrastructure, legacy systems, specific device integrations, strict security requirements, or workflows that standard software cannot cover properly.
For Winder, the requirements were shaped by the client’s need to improve the safety and operational efficiency of critical facilities. Computools had to define how the system would process device data, perform real-time calculations, support predictive analysis, and help teams respond to potential risks. This requirements phase gave the project a clear technical direction before implementation started.
3. Map energy data sources and integration points
After defining business goals, the team should map all data sources that the system will use. Energy optimization depends on data completeness, update frequency, and technical compatibility between devices, operational systems, and analytical modules.
This step should cover meters, IoT sensors integration, equipment controllers, SCADA systems, BMS, ERP, CMMS, maintenance platforms, tariff databases, production planning tools, weather data, and manual reporting sources. The team should document what each source provides, how reliable the data is, how often it is updated, and whether the system can access it via APIs, databases, file exchange, gateways, or custom connectors.
For energy monitoring and analytics software, this mapping is critical because the platform cannot generate accurate alerts, forecasts, or optimization recommendations if the input data is fragmented or inconsistent. The system should receive energy readings in a format that allows comparison across facilities, assets, periods, and operating conditions. This requires clear rules for data normalization, validation, synchronization, and error handling.
The team should also define how different data types will be processed:
• real-time readings from meters and connected devices;
• historical consumption data for trend analysis;
• equipment logs for asset-level diagnostics;
• production or occupancy data for contextual analysis;
• tariff and demand-charge data for cost optimization;
• maintenance records for detecting efficiency losses;
• environmental data for weather-related demand forecasting;
• manual inputs that still affect reports or operational decisions.
At this stage, it is important to identify data gaps. Some facilities may lack submetering. Some devices may provide readings too rarely for real-time monitoring. Some legacy systems may not support direct integration. These limitations should be documented before architecture planning, because they affect the technical scope, budget, rollout sequence, and expected accuracy of the future system.
For Winder, data mapping was directly connected to device integration. Computools analyzed device API capabilities, field communication strategies, and algorithm requirements before implementation. This helped define how energy-related devices would exchange data within a single system and how the platform would support reliable, real-time calculations across critical facilities.
Energy optimization depends on reliable data collection and analytics. Computools also covers this topic in detail in its article on Big Data in the oil and gas industry, including data collection, predictive analytics, real-time decision-making, and process optimization.
4. Design the platform architecture and data processing logic
After mapping data sources, the team should define how the system will collect, process, store, analyze, and present energy data. Architecture decisions made at this stage affect system performance, calculation accuracy, scalability, security, and the ability to add new facilities or optimization scenarios later.
The architecture should support several data flows at once. Real-time device readings may be needed for alerts and operational response. Historical consumption data should be stored for trend analysis, benchmarking, forecasting, and model training. Configuration data, user actions, event logs, maintenance records, and tariff information should also be structured so the platform can connect energy behavior with operational context.
A typical architecture should define:
• device connectors and communication protocols;
• data ingestion pipelines;
• validation and cleansing rules;
• storage for structured and unstructured data;
• real-time processing logic;
• historical analytics layers;
• APIs for internal and external integrations;
• role-based access control;
• logging, audit trails, and cybersecurity controls;
• deployment, scaling, and backup strategy.
For energy systems, the architecture should also separate critical calculations from interface-level functionality. Calculations related to safety, load behavior, alerts, or predictive analysis should run reliably even when the user interface is under heavy load or when some external integrations are delayed. This is especially important for industrial, utility, and critical infrastructure environments, where system delays can affect operational response.
At this stage, the team should also decide which parts of the system require real-time processing and which can be handled via scheduled updates. Live alerts, device status, threshold violations, and safety-related calculations usually need fast processing. Monthly reports, sustainability summaries, cost comparisons, and long-term efficiency analysis can often run in scheduled batches.
For Winder, software architecture planning was directly connected to performance and reliability. Computools used Java for the system foundation, Golang for scalable high-performance components, and C++ for performance-critical parts. PostgreSQL supported structured data, while MongoDB handled unstructured data. Docker and Kubernetes helped package, deploy, scale, and manage the system across environments.
This technical foundation made energy optimization platform development more stable and adaptable. The system could perform complex calculations, integrate various device types, support predictive analytics, and remain responsive as the client’s operational requirements changed.
5. Set up monitoring logic, thresholds, and alerts
Once the architecture is defined, the team should decide how the system will monitor energy behavior in daily operation. This includes live device readings, asset status, consumption thresholds, abnormal load patterns, downtime indicators, and events that require attention from engineers or facility teams.
The monitoring logic should reflect the operating context and use dynamic thresholds. A temporary consumption spike during scheduled production may be normal, while the same spike during idle hours may indicate waste, incorrect equipment configuration, or a technical fault. The system should compare live data with historical patterns, planned schedules, equipment parameters, tariff periods, and safety requirements.
At this stage, the team should define:
• which assets and facilities require continuous monitoring;
• which parameters should trigger alerts;
• how thresholds differ by asset type, operating mode, shift, or season;
• which alerts require immediate escalation;
• who receives notifications and through which channels;
• how incidents are logged, reviewed, and resolved;
• how false positives are identified and reduced over time.
Real-time energy monitoring is especially important for critical facilities, industrial environments, and energy companies where delayed response can affect safety, asset performance, or operating costs. The system should show what happened, where it happened, how serious the deviation is, and which team should act. Alert messages should be specific enough to support a decision and clearly explain the detected deviation.
For Winder, this capability was one of the core project requirements. The client’s existing systems were complex and often required expert investigation because they could not perform real-time calculations. Computools developed a customized system that integrated energy-related devices, supported real-time calculations, and helped teams respond to potential risks more quickly. This improved the client’s ability to maintain safety standards and manage operational events across large physical facilities.
6. Develop predictive models and optimization scenarios
After the monitoring logic is in place, the system can move from observation to forecasting and decision support. Predictive AI models help energy teams understand how consumption may change under different operating conditions, which assets may contribute to future load peaks, and where early intervention can reduce waste, costs, or operational risk.
The modeling process should start with historical data analysis. The team should review past consumption patterns, equipment behavior, production schedules, weather influence, tariff periods, maintenance events, and abnormal operating conditions. This helps define which variables actually affect energy use and which signals are too weak, incomplete, or unreliable for automation.
The system can support several types of predictive scenarios:
• short-term energy demand forecasting;
• peak-load prediction by facility, asset, or production cycle;
• anomaly detection for abnormal consumption patterns;
• equipment behavior analysis;
• predictive maintenance signals related to energy inefficiency;
• recommendations for load shifting or schedule adjustment;
• simulation of different operating modes;
• resource allocation planning based on expected demand.
For AI-powered energy optimization, model quality depends on the data foundation prepared in previous steps. AI models should be trained on clean historical data, tested against real operational cases, and validated by domain experts before being used in production. In energy environments, a technically accurate model still needs operational validation because equipment limits, safety rules, and process dependencies can restrict which recommendations are acceptable.
The team should also define how predictions will appear in the system. Some recommendations may be shown as alerts. Others may appear as forecast charts, risk scores, ranked optimization opportunities, or suggested configuration changes. For critical systems, predictive outputs should include enough context for users to understand what triggered the recommendation and how urgent the response should be.
For Winder, predictive analysis was one of the core components of the solution. Computools developed algorithms that helped the system forecast events and support intelligent decision-making in different operational situations. The system could also assess how devices should be placed and configured to improve performance and safety across large physical facilities.
For a deeper look at AI use cases in forecasting, demand prediction, asset management, cybersecurity, and operational efficiency, read our article on AI in the Energy Industry.
7. Design dashboards, reports, and decision workflows
After predictive logic is defined, the system needs an interface that helps users interpret energy data and act on it. At this stage, the team should decide how different user groups will access information, which metrics they need, and which actions they can take on the platform.
The interface should provide role-specific views for different user groups. Executives need high-level KPIs, cost trends, emissions indicators, and facility comparisons. Energy managers need consumption patterns, alerts, optimization opportunities, forecast accuracy, and savings potential. Engineers need asset-level readings, event logs, device status, configuration details, and technical diagnostics. Administrators need user management, access rights, system settings, and audit history.
A well-designed energy management software interface should include:
• facility-level and asset-level dashboards;
• real-time and historical consumption views;
• peak-load and baseload analysis;
• alerts, incidents, and escalation status;
• forecast charts and predictive recommendations;
• cost and tariff-related reports;
• emissions and sustainability metrics;
• exportable reports for finance, compliance, and management teams;
• role-based access and approval workflows.
Reporting logic should be designed together with the dashboard structure. The system should define which reports are generated automatically, which require manual review, who receives them, and how often they are updated. For companies with several facilities or regions, reports should allow comparison by site, asset group, time period, operating mode, and business unit.
Decision workflows are equally important. If the platform detects abnormal consumption or recommends an optimization action, users should understand what happened, what caused the issue, what impact it may have, and what action is expected. This may include assigning a task, escalating an alert, approving a configuration change, or documenting why no action was taken.
For Winder, interface design was part of the full product development process. Computools created user personas, a site map, wireframes, and the user interface before implementation. Angular was used for the front end, helping present complex system data in a structured, usable way. This mattered because the platform needed to support device data, real-time calculations, predictive analytics, and critical facility workflows within a single environment.
8. Plan mobile access for field and operations teams
After dashboards and reporting workflows are defined, the team should decide whether field teams need mobile access to energy data outside the control room or office. In many energy and industrial environments, technicians, field engineers, facility managers, inspectors, and maintenance teams need timely access to alerts, asset data, checklists, and incident details directly on site.
Mobile access should be planned around real field conditions. Teams may work across large facilities, remote assets, areas with unstable connectivity, or locations where desktop access is impractical. The mobile interface should therefore focus on fast task completion, clear visibility of alerts, secure authentication, and access to the most relevant operational data.
Core mobile functionality may include:
• live alerts and push notifications;
• asset profiles and equipment status;
• inspection checklists;
• incident and maintenance notes;
• photo or document uploads;
• task assignment and status updates;
• offline access for areas with weak connectivity;
• synchronization with the main platform;
• role-based access for field and facility teams.
At this stage, mobile app development services help extend the energy optimization system to the people who physically interact with equipment and facilities. The mobile layer should focus on field tasks: confirming asset status, responding to alerts, documenting site conditions, updating tasks, and escalating issues when required.
For Winder, mobile access was part of the technical solution. Computools used Flutter to support mobile applications, allowing users to access the system from mobile devices. This was relevant for a project built around critical facilities, connected devices, real-time calculations, and operational response, where access to system data had to remain practical beyond a desktop interface.
9. Pilot the system, validate workflows, and train users
Before a full rollout, the company should test the system in a controlled environment. A pilot can focus on one facility, one asset group, one production line, or one operational scenario in which energy data is sufficiently reliable to validate calculations, alerts, reports, and user workflows.
The pilot should check both technical performance and practical usability. The team needs to confirm that data is collected correctly, integrations work without delays, alerts are meaningful, dashboards support real decision-making, and reports align with the company’s internal logic. If the system generates too many false alarms or provides recommendations that users cannot implement, these issues should be corrected before scaling.
The validation process should cover:
• data accuracy across connected meters, sensors, and systems;
• calculation logic for consumption, cost, peaks, and deviations;
• alert thresholds and escalation paths;
• predictive model outputs;
• dashboard usability for different user roles;
• report structure and export formats;
• system performance under live or near-live data load;
• security, access control, and audit logs;
• integration stability with legacy systems.
Training should run in parallel with the pilot. Energy managers, engineers, field teams, facility operators, and executives need different levels of system knowledge. Technical users should understand how data is collected, how alerts are triggered, how recommendations are generated, and how incidents should be documented. Business users should understand KPIs, reports, savings logic, and sustainability metrics.
This stage is also where smart energy management becomes part of daily operations. Users need clear procedures for reviewing alerts, approving optimization actions, escalating risks, correcting data issues, and giving feedback on model accuracy.
For Winder, Computools used an iterative Scrum-based process with regular reviews and feedback. This was important because the project involved expert input, complex device communication, real-time calculations, and changing operational needs. After implementation, Computools also provided maintenance and updates, which helped keep the system responsive and adaptable after launch.
10. Monitor results, improve the system, and scale gradually
After launch, the system should be monitored as an operational product that requires regular review, improvement, and scaling. Energy behavior changes over time: equipment ages, production schedules shift, tariffs are updated, facilities expand, and sustainability requirements become stricter. The platform should therefore be reviewed regularly to confirm that alerts, reports, predictions, and optimization rules remain accurate.
The team should track both technical and business performance. Technical monitoring shows whether integrations are stable, data is complete, calculations run correctly, and the system performs under live data load. Business monitoring shows whether the platform helps reduce waste, improve response time, lower energy costs, support compliance, and improve the accuracy of resource allocation.
The review process should include:
• energy consumption trends before and after launch;
• peak-load reduction and demand-related cost changes;
• abnormal consumption events detected by the system;
• alert accuracy and false-positive rates;
• model performance and forecast accuracy;
• user adoption across operations, engineering, and management teams;
• reporting quality for finance, compliance, and sustainability teams;
• new requirements from facilities, business units, or regulators.
This is where sustainable operations software becomes a long-term asset. The system should support continuous improvement by showing which optimization actions work, which facilities need additional attention, and which processes require better data, updated rules, or new automation logic.
For Winder, Computools provided ongoing maintenance and updates after implementation. This helped keep the system responsive to changing needs and ensured that the platform remained useful beyond the initial release. For similar energy optimization projects, this stage is also where companies can scale the platform to new facilities, add more device types, expand reporting, improve predictive models, and introduce new optimization scenarios over time.
Launch your energy optimization system within 1–3 months instead of years. Stay informed, not overwhelmed. We handle execution.
What mistakes should companies avoid when building an energy optimization system?
Energy optimization projects usually fail due to inadequate preparation, poor data quality, unclear ownership, or workflows that do not align with real operating conditions. The following mistakes should be addressed before the system reaches full-scale implementation.
| Mistake | Why it matters | How to avoid it |
| Starting without a reliable energy baseline | Without baseline data, the team cannot measure savings, define realistic KPIs, or identify priority assets. | Audit consumption patterns, peak-load periods, baseload levels, asset-level demand, tariffs, and recurring inefficiencies before development starts. |
| Confusing monitoring with optimization | Dashboards and charts show what happened, but they do not automatically reduce energy waste. | Build energy efficiency software that supports anomaly detection, benchmarking, forecasting, recommendations, and response workflows. |
| Ignoring operational and safety constraints | In industrial energy optimization, some assets cannot be freely adjusted because of safety, uptime, temperature, pressure, voltage, or compliance limits. | Document operational constraints during discovery and include them in optimization rules, alerts, and approval workflows. |
| Building on fragmented or low-quality data | Delayed, duplicated, or incomplete data leads to unreliable alerts, forecasts, reports, and optimization recommendations. | Define data ownership, validation rules, update frequency, integration logic, and error handling early. For Winder, Computools researched device APIs and field communication before implementation. |
| Underestimating legacy system integration | Energy environments often include older monitoring tools, spreadsheets, controllers, custom databases, and manual approval processes. | Map legacy systems during discovery, including APIs, data formats, access rights, cybersecurity limits, and integration risks. |
| Separating sustainability reporting from operations | If sustainability data is disconnected from operational energy data, teams spend more time manually reconciling reports. | Connect sustainability software development with consumption data, emissions factors, energy intensity metrics, facility performance, and report exports from the start. |
| Skipping user training and workflow ownership | A strong system can underperform if users do not understand how to interpret alerts, approve actions, or maintain rules. | Define who reviews alerts, investigates anomalies, updates system logic, owns reporting, and trains each user group before rollout. |
For companies comparing technology partners, Computools also prepared an overview of the Top 30 Energy Software Development Companies in 2026, covering vendors with relevant energy expertise, delivery experience, and software development capabilities.
Why is Computools a strong technology partner for energy companies?
Companies work with Computools on energy projects that involve complex integrations, real-time visibility, predictive analytics, secure architecture, and measurable operational value. The team develops custom software for utilities, energy producers, green tech startups, electric power providers, and oil and gas companies, helping them modernize legacy systems, automate monitoring, improve asset control, and reduce waste.
Computools’ energy portfolio includes real-time monitoring tools, ESG compliance platforms, predictive analytics software, smart grid systems, utility platforms, and field operation products. The company reports a 45% gain in operational efficiency, a 35% reduction in energy waste, 40+ delivered energy projects, and 250+ experts involved in custom software delivery.
For fuel production, transportation, and distribution companies, Computools provides oil and gas software development covering asset management, pipeline monitoring, field data capture, ERP systems, and real-time analytics. These capabilities are relevant for businesses that operate distributed assets, remote facilities, strict safety workflows, and data-heavy field operations.
For utilities and power providers, Computools offers electric power software development for custom energy management systems, demand response platforms, renewable energy monitoring, outage management, smart grid analytics, and utility workflow automation. This experience supports projects where reliability, load forecasting, grid visibility, and regulatory reporting are business-critical.
Computools also has strong product engineering expertise. Its web development services help transform complex operational data into dashboards, reporting tools, admin panels, and analytics interfaces for energy managers, engineers, executives, and compliance teams.
The company’s case portfolio shows this experience in practice. For Winder, Computools developed a customized web system that connected energy-related devices, performed real-time calculations, and used advanced algorithms for predictive decision-making.
For Drone Analytics, the team built a web system that unified turbine inspection data and improved maintenance efficiency.
For MeterSnap, Computools applied AI and computer vision to utility data management, supporting meter reading validation in low-connectivity environments.
This makes Computools a strong partner for companies that need scalable energy software with reliable data flows, secure integrations, predictive capabilities, and practical tools for daily operations.
Ready to modernize your energy operations? Contact Computools at info@computools.com to discuss a custom energy optimization system built around your infrastructure, data, and business goals.
Conclusion
A successful energy optimization system depends on accurate data, reliable integrations, real-time visibility, predictive logic, and workflows that reflect real operational constraints. When built properly, it helps companies reduce waste, improve asset control, support sustainability goals, and make faster, more data-driven energy decisions.
Computools
Software Solutions
Computools is an IT consulting and software development company that delivers innovative solutions to help businesses unlock tomorrow.


