
THE AUTHOR:

Investment firms use more and more data sources to analyze the performance of their portfolios as well as the liquidity, risks, and outcomes for their investors. Effective investment reporting workflow needs to integrate data from portfolio companies, accounting systems, custodians, administrators of funds, CRM platforms, market data vendors and internal data models, and ensure that calculations and data are consistent.
This problem is becoming larger and challenging firms more than before. PwC showcases that there will be a vast increase in the global assets managed, from $139 trillion to $200 trillion by 2030, while 89 percent of surveyed asset managers already noted a negative impact on their profitability. Further, private-market reporting is becoming more organized and structured. The Institutional Limited Partners Association introduced Reporting Template 2.0 and a new Performance Template, with implementation beginning in Q1 2026 to standardize quarterly reporting, performance calculations, and underlying fund data.
For investment firms, the response is a reporting environment where data is collected once, validated against defined rules, reconciled across systems, and reused for portfolio monitoring, risk analysis, management reporting, and LP communication. This requires a combination of financial software development services, data integration, governed calculation logic, analytics, and workflow automation.
This article describes how to best fit the portfolio reporting process within the organization, the performance and risk indicators that portfolio teams should monitor and report, how the latest reporting framework connects various financial systems, and where the use of AI and automation will help to reduce repetitive manual tasks while maintaining control over the integrity of investment data.
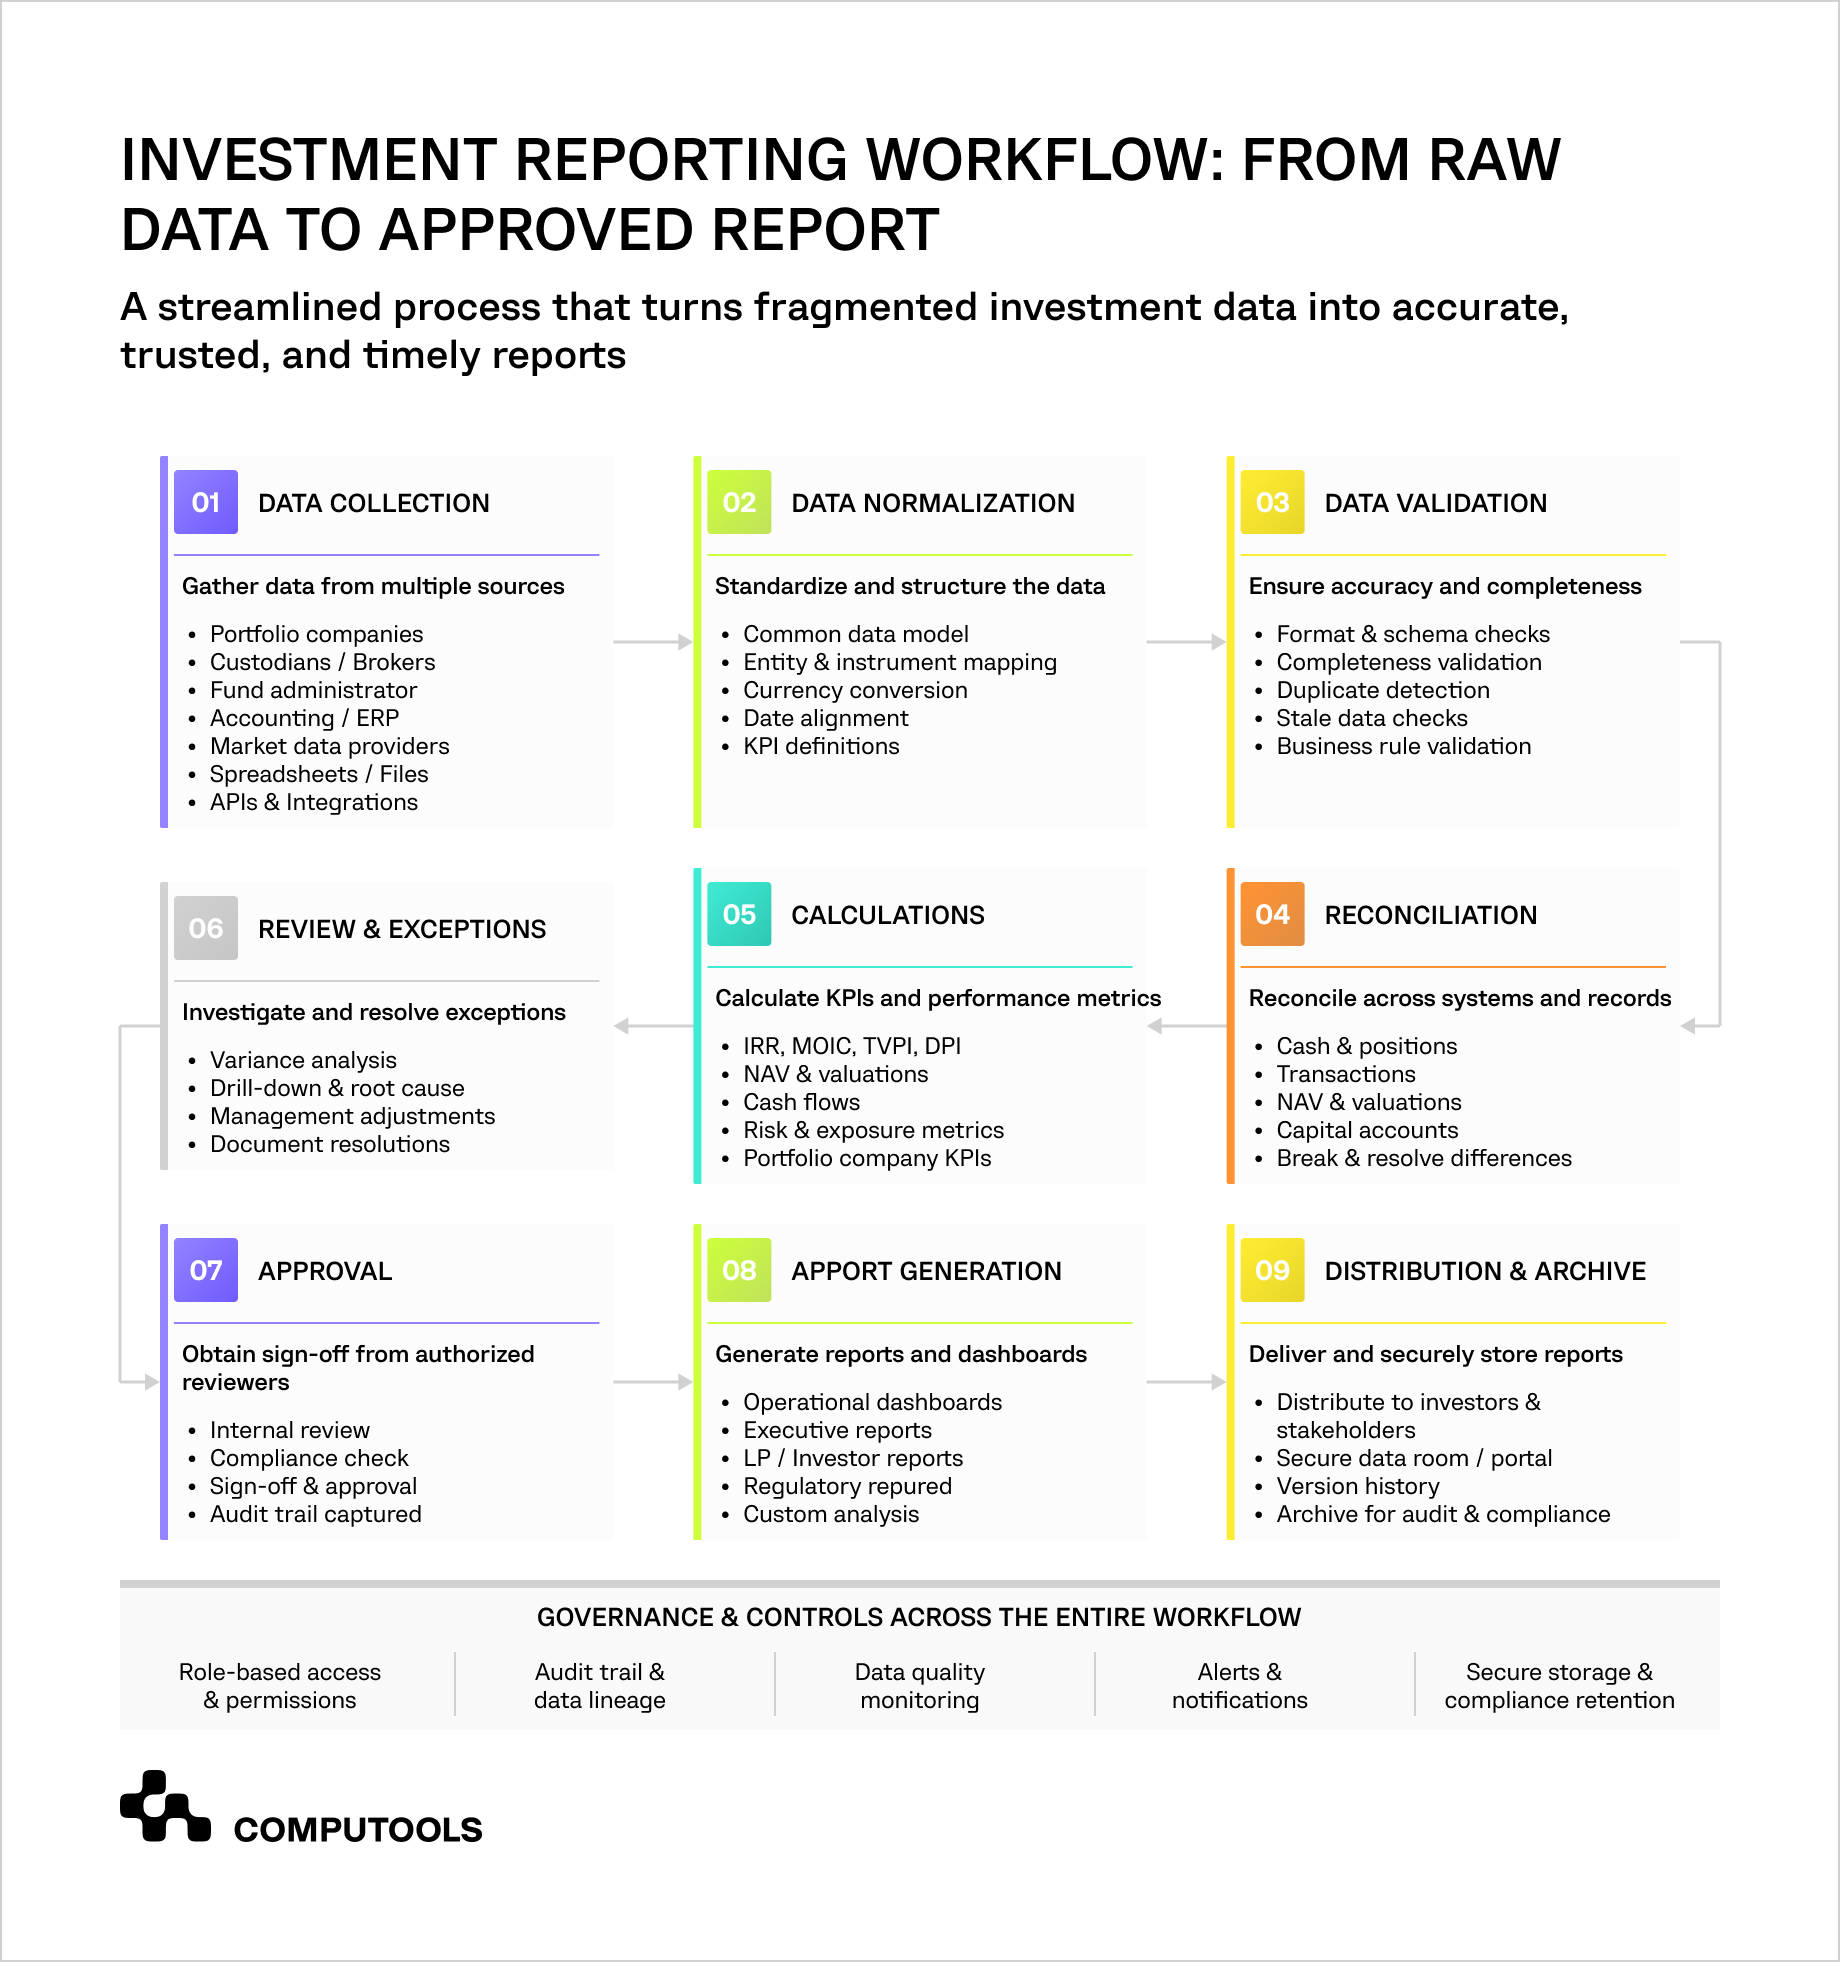
What does an investment reporting workflow involve?
An investment reporting workflow consists of data collection, data accuracy verification, performance and risk calculation, exception analysis, results approval, and report distribution to teams and investors. It ingests data used for operational monitoring of portfolios and provides flexible financial and LP reporting. The reporting workflow allows users to analyze asset performance using the same underlying data for multiple reporting formats.
A typical portfolio reporting workflow covers nine major steps: data collection → validation → reconciliation → calculation → review → approval → report generation → distribution → archiving.
The data can be sourced from multiple locations, including portfolio companies, custodians, accounting, administrative services, CRM, market data services, and internal spreadsheets. The reporting workflow also includes a currency, date, entity identifiers, transaction type, and KPI normalization step.
Validation checks for the completeness and correct format of records. Reconciliation then matches data across systems. This may take the form of cash movements being compared to accounting records, or confirming that positions within a portfolio match the custodian data. Any discrepancies should be routed for review rather than silently included in downstream calculations.
Once the basic information is provided, calculation engines compute numerous metrics including IRR, MOIC, TVPI, DPI, NAV, portfolio exposure, and company-level KPIs. The output is reviewed and approved for posting to dashboards, investor portals, PDF reports, or provided in EXPORT files.
This methodology is important for firms with multiple funds or different types of investment, asset classes, or reporting entities. Without this type of structure, different groups would calculate the same metrics in different ways or use different versions of the same data.
Investment reporting typically involves multiple teams with different functions, such as investment, portfolio operations, finance and fund accounting, risk, investor relations and LP (limited partner) reporting teams. The goal is not to build a unique reporting system for each stakeholder. A more efficient option would be to develop a governed reporting layer that provides multiple views depending on the role, reporting purpose and access.
This is where Computools investment software development services can support firms that need to connect fragmented data sources, calculation logic, dashboards, and approval workflows within one reporting environment.
Also, data engineering becomes central to the reporting architecture. Ingestion pipelines are required to consolidate APIs, files (both structured and unstructured), spreadsheets, and other external financial data in order to transform them into a consistent portfolio model.
What portfolio teams need to track
To track both performance and issues, portfolio teams require reporting. The specific metrics would depend on the asset class, fund structure and investment strategy. However, most firms require a combination of performance, cash flow, valuation, operating, liquidity and risk data.
1. Investment and fund performance
Core performance metrics typically include:
- IRR to measure annualized returns while accounting for the timing of cash flows.
- MOIC to show total value generated relative to invested capital.
- TVPI to compare total portfolio value, including realized and unrealized investments, with paid-in capital.
- DPI to measure how much capital has already been returned to investors.
- RVPI to show the remaining unrealized value relative to paid-in capital.
- NAV to track the current net value of fund assets after liabilities.
- Realized and unrealized gains.
- Benchmark-relative performance.
- Time-weighted returns where relevant for liquid portfolios.
For reliable investment performance reporting, firms also need consistent rules for valuation dates, currencies, fees, subscription facilities, and whether figures are shown on a gross or net basis.
2. Cash flows and capital activity
Performance figures become much easier to interpret when they are connected to the underlying cash movements.
Portfolio and finance teams may need to track:
- Capital calls.
- Investor contributions.
- Distributions.
- Investment purchases and exits.
- Management fees.
- Fund expenses.
- Unfunded commitments.
- Expected future capital requirements.
- Available cash.
- Forecast distributions.
- Debt repayments and interest.
For private-market funds, this part of the portfolio reporting process is especially important because timing directly affects return calculations and liquidity planning.
A reporting system should also distinguish between actual, committed, and forecast cash flows. This allows investment teams to understand current liquidity while finance teams can prepare for upcoming calls, expenses, or distributions.
3. Portfolio company KPIs
Financial returns alone may show what has already happened. Operating KPIs help teams understand what is driving those results.
Depending on the sector and investment thesis, portfolio teams may monitor:
- Revenue growth.
- EBITDA and EBITDA margin.
- Gross margin.
- ARR or MRR.
- Customer retention and churn.
- CAC and LTV.
- Order volume.
- Utilization.
- Headcount.
- Working capital.
- Burn rate.
- Cash runway.
- Debt.
- Budget versus actual results.
The main challenge is standardization. A revenue-growth percentage is only useful for portfolio comparison if firms calculate it using the same period, currency, and underlying definition.
A practical model is to maintain a common set of portfolio-wide KPIs while allowing additional sector-specific metrics for SaaS, healthcare, manufacturing, retail, energy, or other investment categories.
4. Risk and portfolio exposure
Portfolio performance reporting should also explain where returns are concentrated and where potential losses may emerge.
Common risk indicators include:
- Exposure by asset.
- Sector concentration.
- Geographic exposure.
- Currency exposure.
- Counterparty exposure.
- Credit risk.
- Leverage.
- Interest-rate sensitivity.
- Liquidity risk.
- Drawdowns.
- Covenant compliance.
- Valuation changes.
- Portfolio correlations.
- Scenario and stress-test results.
Risk reporting becomes valuable when performance and exposure are integrated. An example of this would be a portfolio showing a significant return, but becoming overly concentrated in a single industry, currency, or geographic region.
Early-warning rules can also identify changes that require attention, such as declining cash runway, missed budgets, rising leverage, covenant breaches, sharp valuation movements, or deteriorating operating KPIs.
Risk monitoring can also depend on external verification and credit data. For Invest Latam, Computools integrated financial services supporting KYC, verification, creditworthiness checks, and secure payments, giving investors structured information for evaluating lending opportunities.
5. Liquidity and funding capacity
Liquidity reporting should show whether the fund can meet its expected obligations under normal and stressed conditions.
Portfolio teams may track:
- Current cash.
- Expected inflows.
- Expected distributions.
- Capital calls.
- Unfunded commitments.
- Debt facilities.
- Upcoming investment requirements.
- Exit proceeds.
- Liquidity under different scenarios.
The appropriate reporting frequency depends on the portfolio. A liquid securities portfolio may require daily or intraday visibility, while a private equity fund may rely on monthly or quarterly reporting combined with cash forecasts for upcoming commitments.
6. Investor and fund-level reporting
Investor Relations and finance teams need another layer of information for LP reporting and fund administration.
This can include:
- Investor commitments.
- Paid-in capital.
- Remaining commitments.
- Ownership percentages.
- Capital accounts.
- NAV by investor or vehicle.
- Contributions and distributions.
- Fees and expenses.
- Carried interest.
- Historical statements.
- Performance by fund, vehicle, or investor class.
A well-structured investment portfolio reporting environment should generate these views from the same governed data used for internal portfolio analysis, rather than requiring teams to rebuild figures separately for each investor report.
7. ESG and other non-financial metrics
Some investment firms track ESG, sustainability, regulatory or impact data and indicators. Examples include carbon emissions and energy consumption, workforce data, governance, diversity metrics, and sector-specific sustainability targets.
Metrics must be included in investment frameworks as long as they correspond to the investment mandate, regulatory or LP requirements, or the risk framework. They must also be treated and reported in accordance with financial data.
The ultimate effect is a more comprehensive approach to portfolio performance tracking and reporting. Teams may now complement the performance metrics with the ones that demonstrate the operational results, cash flow, liquidity and risk of the portfolio.
Modern investment reporting workflow architecture
An effective investment data management and reporting system must integrate portfolio, accounting, market, risk, and investor data and apply consistent validation and calculation rules to data prior to reaching users.
The typical architecture of investment reporting software includes five layers consisting of data sources, integration, data storage, calculation and workflow logic, as well as reporting interfaces.
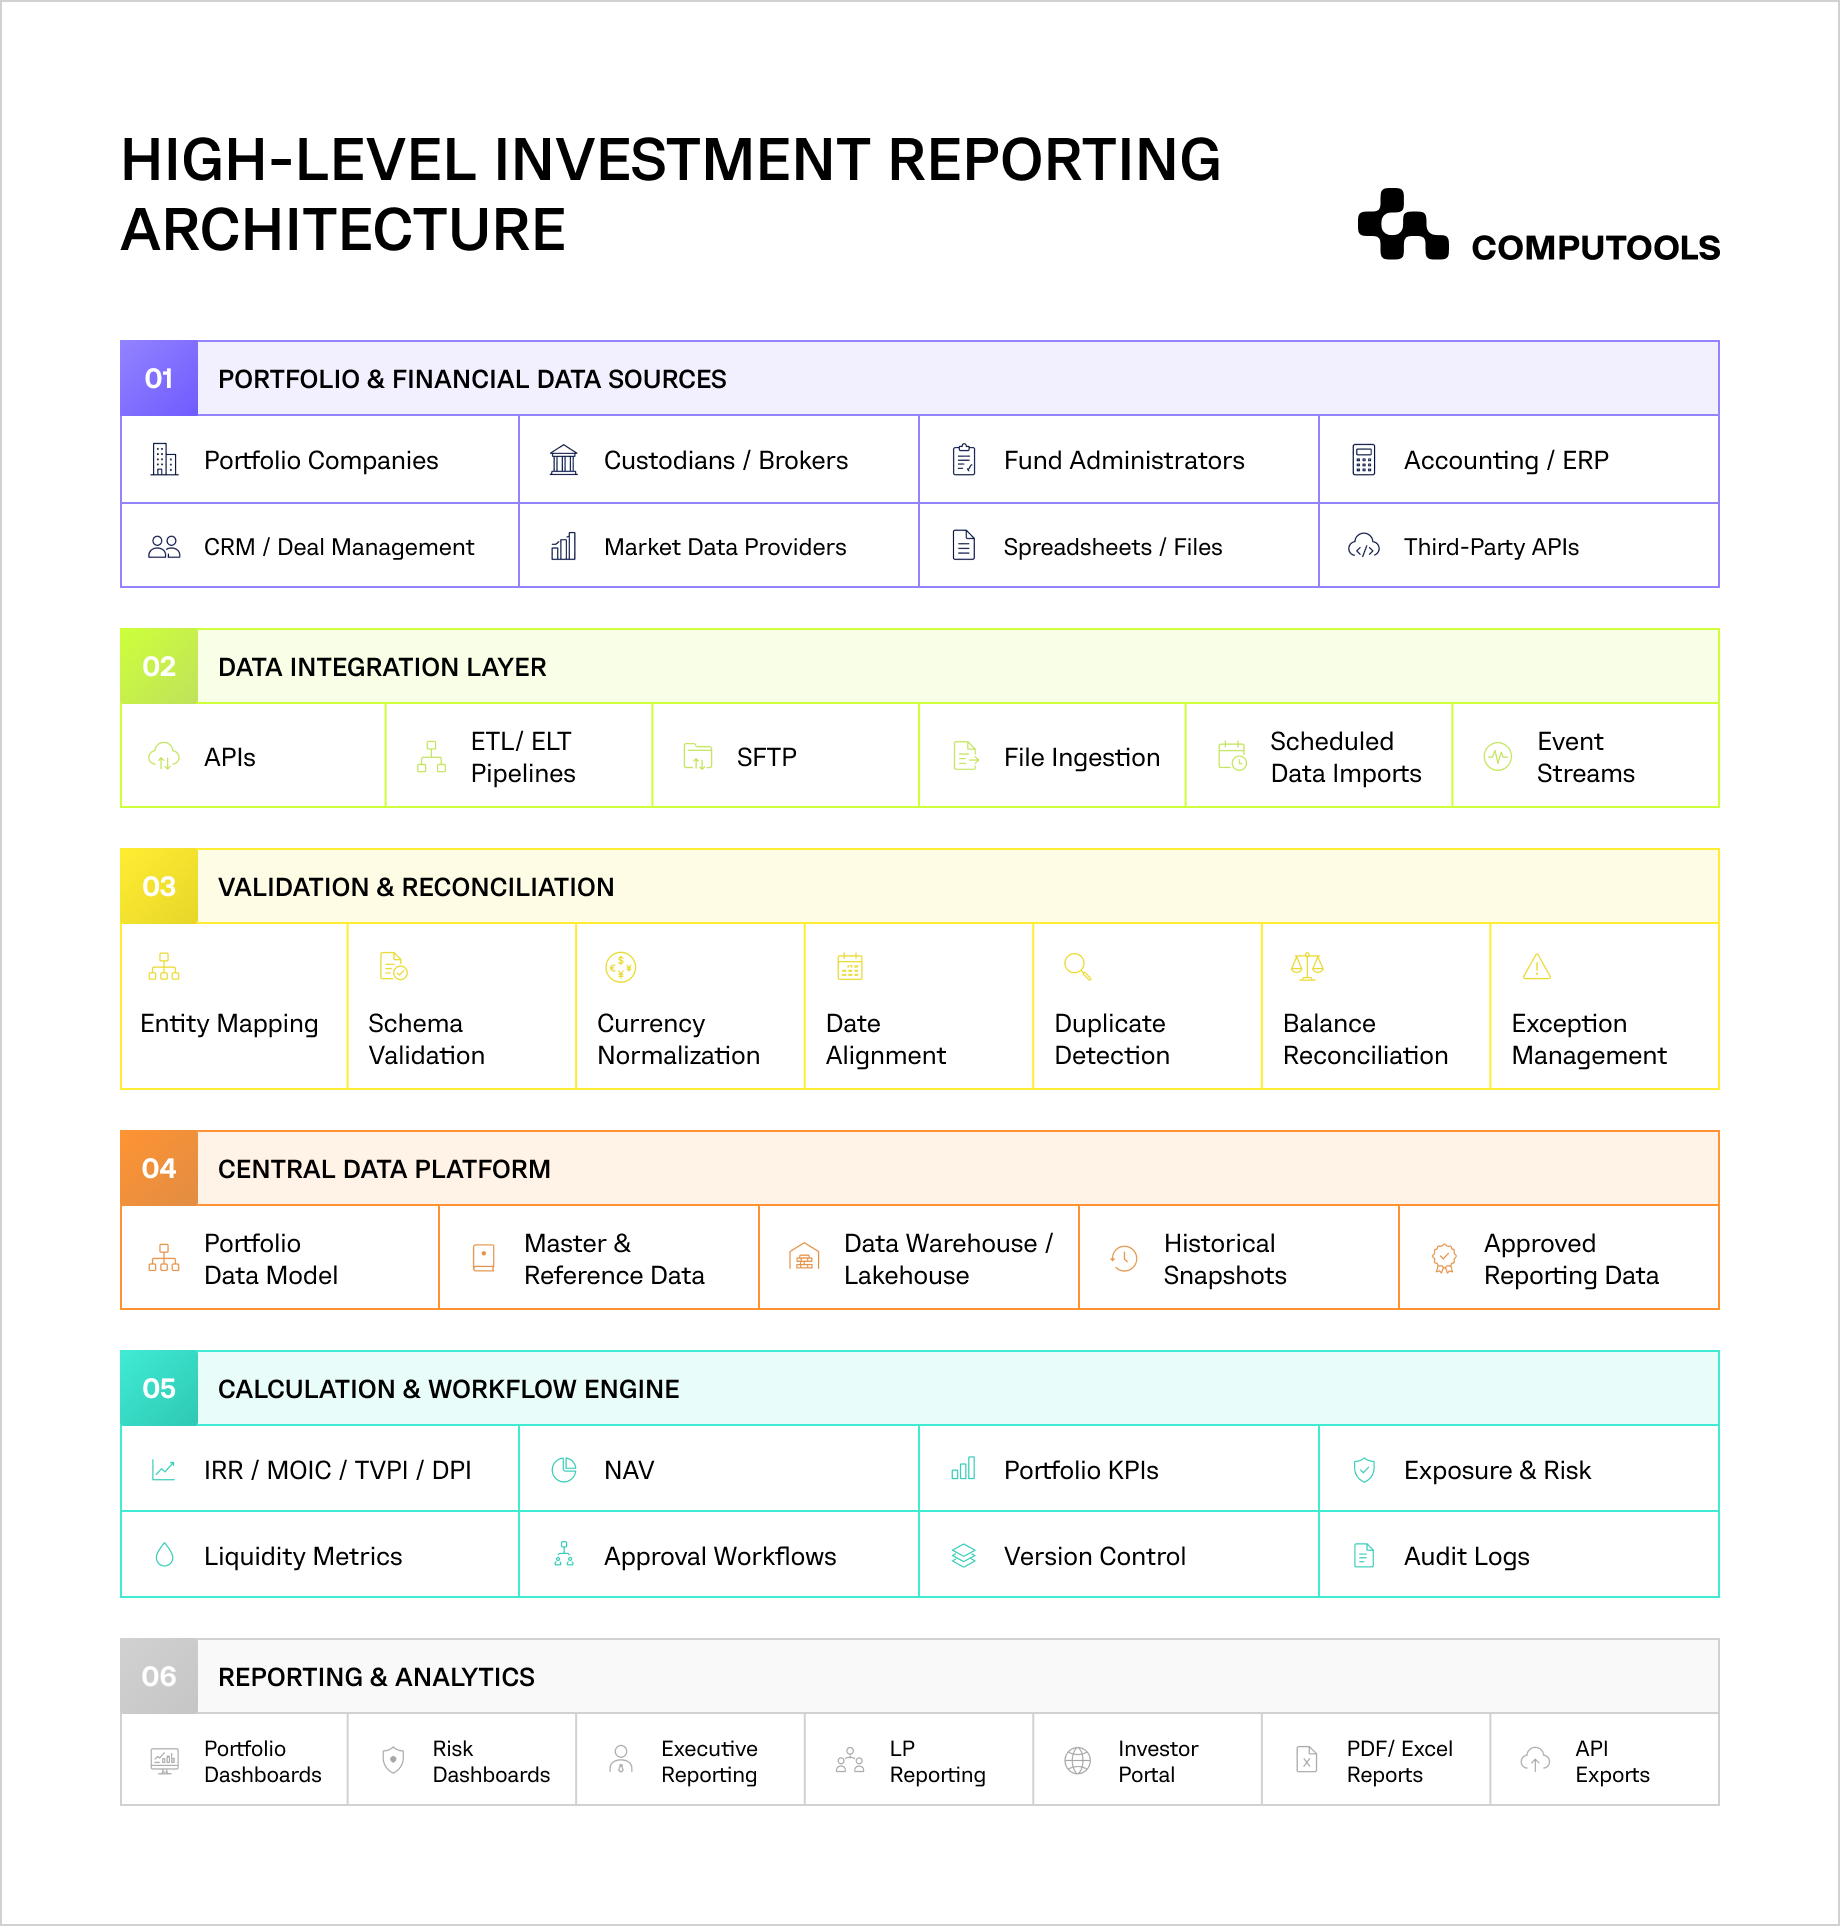
1. Data integration layer
This layer integrates systems that capture investment data. Integrations can be based on APIs, scheduled ETL/ELT pipelines, SFTP feeds, Excel files, CSVs, or direct database connections.
Data transfer is not the only responsibility of an integration layer. It also needs to recognize missing records, incorrect formats, unexpected source changes, and failed imports before bad data reaches downstream reports.
For example, a custodian feed may provide daily positions while portfolio companies submit monthly operating KPIs and a fund administrator provides quarterly accounting data. The reporting platform has to be able to accommodate the different update frequencies and align data to the correct reporting period.
The KenCharts case demonstrates how external market data can feed investor-facing analytics. Computools developed functionality for real-time North American equity prices, technical indicators, detailed share data, filtering, and tracked-stock lists.
2. Validation, mapping, and reconciliation
Data normally needs to pass through a control layer before it enters the reporting model.
Typical controls include:
- Mapping the same investment across different source-system IDs.
- Converting currencies using approved rates.
- Aligning reporting dates.
- Detecting duplicate transactions.
- Checking missing fields.
- Comparing balances across accounting and custodian systems.
- Flagging unexpected KPI changes.
- Identifying stale valuations or market prices.
Exceptions should be routed to the responsible team for review rather than corrected manually inside a finished report.
3. Central portfolio data platform
Once the information is verified, it can be stored in a centralized data model that represents funds, portfolio companies, investments, securities, transactions, investors, currencies, valuations, and reporting periods.
A data warehouse or lakehouse can retain historic records and can capture point-in-time records. This is important for firms that need to produce old reports after data sources have been updated.
The platform should also define master and reference data. For example, the same company can have different names in CRM, accounting, and portfolio systems. A centralized entity model ensures that all three records are treated as the same investment.
4. Calculation and reporting engine
The calculation layer turns validated data into financial and operational metrics.
It may calculate:
- IRR.
- MOIC.
- TVPI and DPI.
- NAV.
- Realized and unrealized returns.
- Exposure by sector, geography, asset, or currency.
- Liquidity.
- Portfolio company KPIs.
- Benchmark comparisons.
- Risk indicators.
Critical calculations should use controlled formulas with version history. If a firm changes the treatment of a fee, valuation, FX rate, or cash flow, the system should preserve which calculation logic was used for each reporting period.
This is especially important for portfolio reporting software, where the same figures may appear in management dashboards, investment committee materials, and investor reports.
5. Workflow, governance, and auditability
Reporting platforms also need to control who can edit, review, approve, and distribute information.
A typical workflow may follow: prepared → validated → reviewed → exceptions resolved → approved → published → archived.
The system should record:
- Who changed the data.
- What was changed.
- Which source was used.
- Which calculation version was applied.
- Who approved the report.
- When the report was distributed.
- Whether figures were later restated.
Role-based access is equally important. Investment teams may need detailed portfolio data, while LPs should only see information associated with their fund, vehicle, or investor account.
6. Dashboards and reporting interfaces
The final layer delivers information to different users without rebuilding the underlying calculations.
A modern investment portfolio reporting platform may include:
- Portfolio manager dashboards.
- Investment committee reporting.
- Executive dashboards.
- Risk and exposure dashboards.
- Portfolio company performance views.
- Investor and LP portals.
- Scheduled PDF or Excel reports.
- API access for downstream systems.
Through web development services, Computools provides browser-based dashboards and investor portals that expose approved data based on each user’s role. Our mobile app development expertise can support selected use cases such as executive portfolio monitoring, alerts, and secure investor access.
The main architectural goal is to separate source systems from reporting logic. Accounting, CRM, portfolio management, market data, and fund administration platforms can remain specialized systems, while the reporting layer creates a consistent view across them. This reduces the need to replace every existing platform and makes it easier to expand reporting as the portfolio, data volume, and investor requirements change.
The CrypDrift project provides an example of an integration-heavy financial architecture. Our team connected crypto market data sources and Interactive Brokers with a platform supporting stocks, cryptocurrencies, price monitoring, and automated trading operations.
For a closer look at the architecture behind investment platforms that process time-sensitive financial data, see How to Build an Investment Management Platform With Real-Time Market Data.
The guide covers market-data integration, portfolio calculations, risk processing, reporting requirements, and architecture for scalable investment systems.
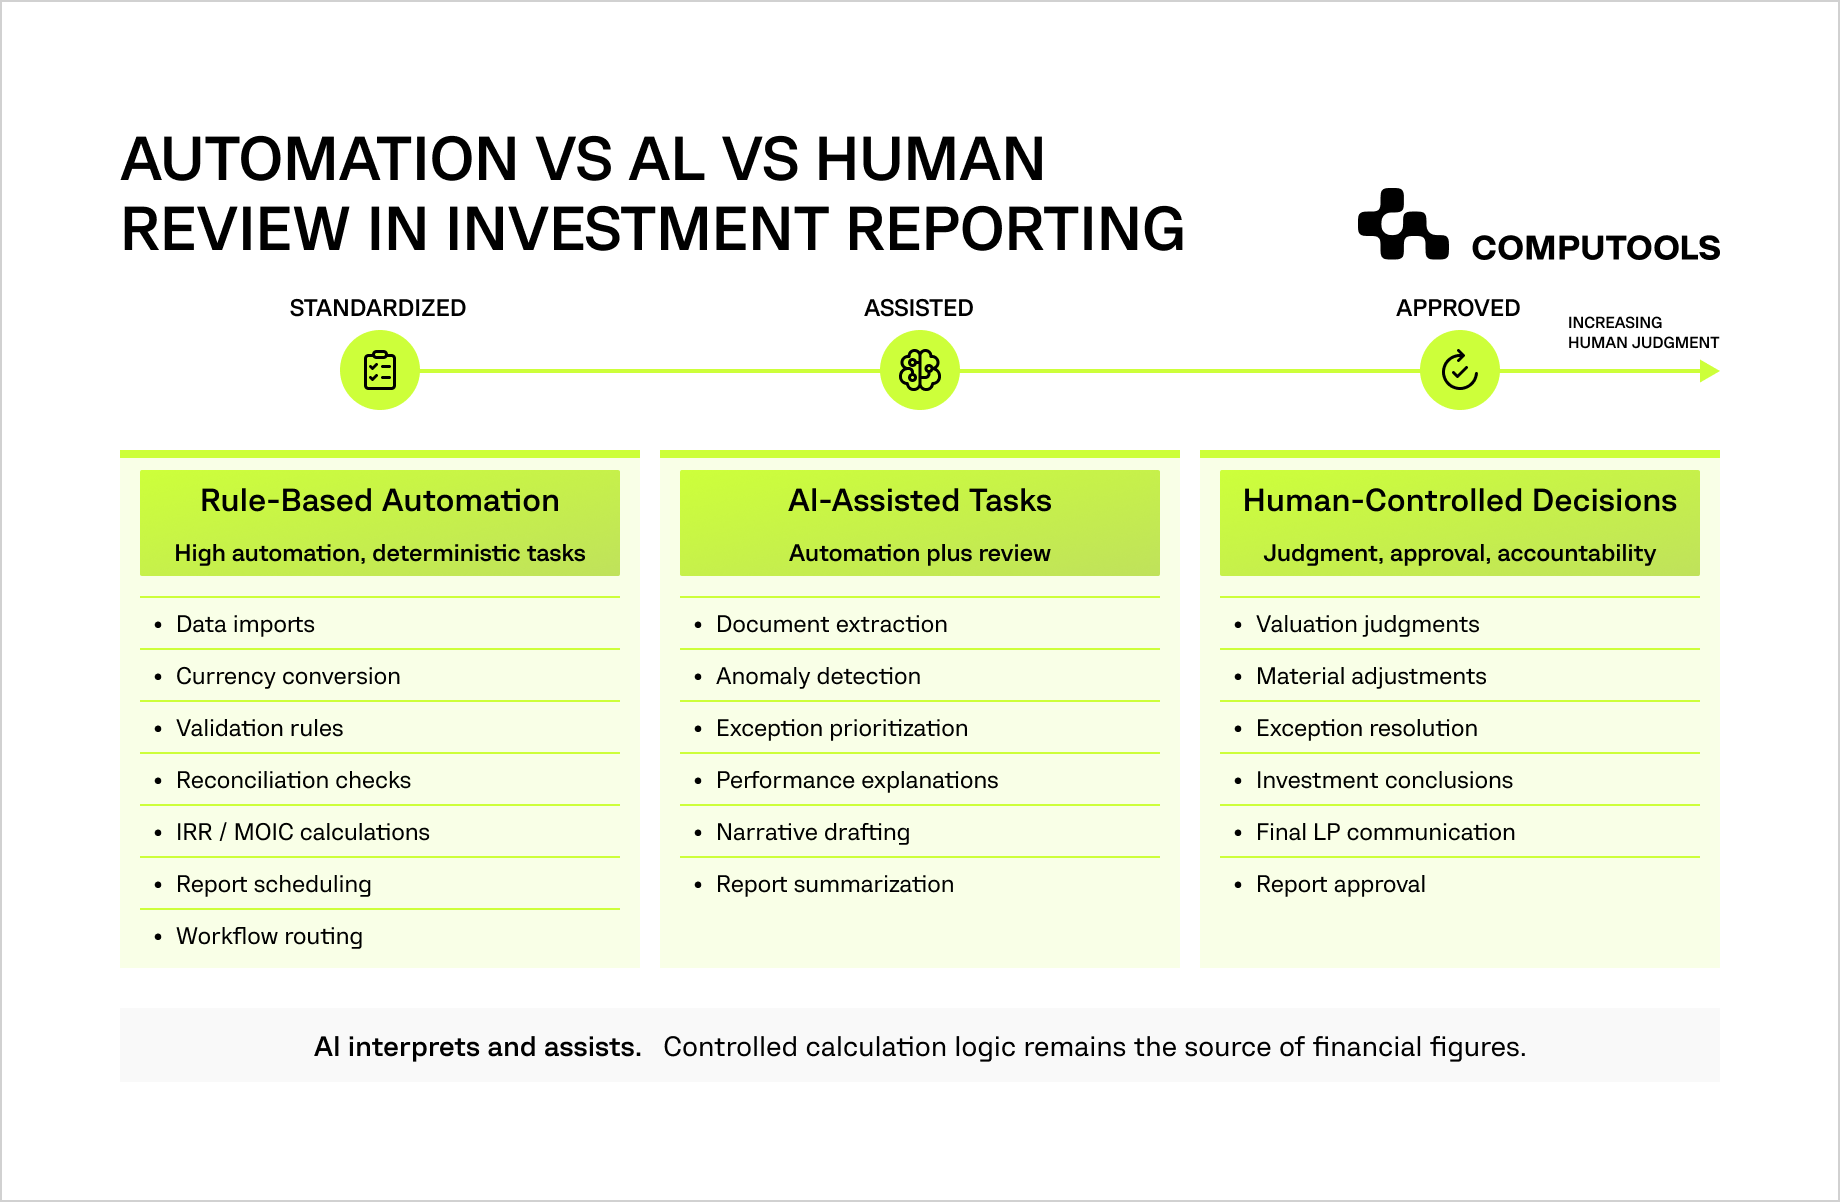
Workflow automation and AI in investment reporting
The goal of investment reporting automation should be to shorten the reporting cycle while preserving calculation accuracy, data lineage, and approval controls.
1. Automated data collection
Many reporting processes still begin with analysts downloading files, copying figures between spreadsheets, requesting updated portfolio company data, and manually loading information into reporting tools.
Automated investment reporting can replace much of this work through:
- API connections to custodians, brokers, market data providers, and financial platforms.
- Scheduled imports from fund administrators and accounting systems.
- SFTP feeds.
- Automated spreadsheet and CSV ingestion.
- Portfolio company reporting portals.
- Document extraction from financial statements and management reports.
- Scheduled synchronization with CRM and portfolio management systems.
Automation is particularly useful when sources update at different frequencies. Daily market data, monthly operating KPIs, quarterly valuations, and investor accounting data can enter the same reporting environment without requiring teams to repeat the collection process for every reporting cycle.
2. Automated validation and reconciliation
Collecting data faster provides little benefit if analysts still need to inspect every record manually.
Validation rules can automatically check:
- Missing values.
- Duplicate transactions.
- Unexpected changes in portfolio positions.
- Stale valuations.
- Currency inconsistencies.
- Broken entity mappings.
- Cash-flow mismatches.
- Differences between custodian and accounting balances.
- Portfolio company KPIs outside expected ranges.
Instead of asking analysts to review every record, the system can route only exceptions for investigation.
For example, if a portfolio company reports a 35% decline in monthly revenue while previous movements stayed within a 5–10% range, the platform can flag the change and request verification before the data is approved.
3. Automated KPI and performance calculations
Once source data is validated, calculation engines can automatically update portfolio and fund metrics such as:
- IRR.
- MOIC.
- TVPI.
- DPI.
- NAV.
- Exposure.
- Liquidity.
- Portfolio company KPIs.
- Benchmark comparisons.
These calculations should remain rule-based and version-controlled. Financial metrics used in investor statements or investment committee reports need reproducible formulas and clear inputs.
This is an important distinction when firms consider how to automate investment reporting. AI can assist around the calculation process, but it should not independently determine authoritative values for NAV, IRR, fees, investor allocations, or other controlled financial figures.
4. AI-assisted data extraction
One useful application of AI is processing information that arrives in semi-structured or unstructured formats.
For example, AI models can extract:
- Revenue and EBITDA from management accounts.
- Cash balances from financial statements.
- Operational KPIs from portfolio company reports.
- Debt and covenant information.
- Forecast figures.
- Management commentary.
Extracted values can then be mapped to the portfolio data model and passed through validation rules before they become part of approved reporting data.
This can reduce manual entry when portfolio companies do not provide standardized APIs or data feeds.
5. Exception detection and investigation
Rule-based systems can identify known errors, while AI can help analyze unusual patterns that are harder to define in advance.
Possible applications include:
- Detecting unusual movements across portfolio KPIs.
- Comparing current figures with historical patterns.
- Identifying inconsistent reporting across companies.
- Prioritizing reconciliation exceptions.
- Suggesting possible causes of unexpected changes.
- Summarizing which portfolio companies require attention.
The final decision should remain with the responsible investment, finance, or risk team.
6. Automated Reporting Narratives
AI can also reduce the time spent writing repetitive reporting commentary. Using approved portfolio data, models can prepare initial drafts of:
- Quarterly portfolio summaries.
- Fund performance commentary.
- Executive reporting.
- Investment committee updates.
- Risk summaries.
- LP reporting commentary.
- Explanations of significant period-over-period changes.
A reporting system could, for example, identify the five largest contributors to quarterly portfolio performance and generate a draft explanation based on approved KPIs and prior-period data.
The figures themselves should come from the controlled calculation layer. AI then converts those figures into readable commentary for review.
Through AI development services, Computools helps organizations introduce these advanced capabilities while connecting models to governed financial data, permissions, and existing reporting workflows.
7. Approval and report distribution
Automation should continue after the calculations are complete.
A typical approval workflow may look like:
Data collected → validation completed → exceptions reviewed → calculations approved → commentary reviewed → report approved → distributed
Different reports can require different approval paths. A portfolio dashboard may update automatically after validation, while a quarterly LP report may require approval from Finance and Investor Relations before publication.
Once approved, the system can distribute reports through:
- Investor portals.
- Email notifications.
- Scheduled PDF reports.
- Excel exports.
- Executive dashboards.
- APIs for downstream systems.
It can also record when each report was generated, approved, published, and accessed.
Computools explains a broader approach to controlled financial automation in How to Build AI Agents for Financial Workflow Automation, including integrations with trusted financial systems, permission controls, exception handling, and audit trails. These principles are directly applicable when AI is introduced into portfolio reporting processes.

Launch your investment reporting platform in 1–3 months, not years, and give portfolio teams a unified way to track performance, valuations, transactions, risk, and investor reporting with less manual work and greater data accuracy.
How to improve investment reporting workflows
The strongest investment reporting best practices focus on data consistency, clear ownership, reproducible calculations, and controls that make every reported figure traceable to its source.
1. Establish a governed source of reporting data
A single source of truth means establishing one approved reporting layer where data is reconciled before it is used in calculations and reports.
For each data category, firms should define an authoritative source.
For example:
- Accounting system for fund expenses and general ledger balances.
- Custodian for securities positions.
- Fund administrator for investor capital accounts.
- Portfolio company submissions for operating KPIs.
- Approved market data provider for prices and FX rates.
- Valuation system or committee-approved records for private asset valuations.
2. Standardize KPI definitions
Portfolio-wide comparisons only work when metrics follow consistent definitions. Each important KPI should have documented rules covering:
- Formula.
- Data source.
- Reporting period.
- Currency.
- Units.
- Update frequency.
- Responsible owner.
- Treatment of missing data.
- Restatement rules.
The reporting platform should maintain a common KPI library while allowing sector-specific metrics where necessary.
3. Build reconciliation into the workflow
Reconciliation should happen before data reaches dashboards and investor reports.
Automated controls can compare:
- Custodian positions with internal portfolio records.
- Cash movements with accounting transactions.
- Capital calls and distributions with investor accounts.
- Portfolio company submissions with prior reporting periods.
- Valuations with approved valuation records.
- Market prices with expected reporting dates.
Material discrepancies should create exceptions with an assigned owner and resolution status.
4. Maintain complete data and calculation lineage
Every material figure should be reproducible.
Teams should be able to determine:
- Where the source data came from.
- When it was received.
- Whether it was adjusted.
- Which transformation rules were applied.
- Which formula version produced the result.
- Who reviewed or approved it.
- Whether the figure was later restated.
This is especially important for NAV, fund performance, investor allocations, fees, and valuation data.
Version control also allows firms to preserve reporting snapshots. If source data changes after quarter-end, the organization can still reproduce the figures originally distributed to investors.
5. Separate operational reporting from formal investor reporting
Different reporting use cases require different levels of control and frequency. Firms should maintain:
- Live or frequently refreshed data for operational monitoring.
- Approved reporting snapshots for management, regulatory, and investor reporting.
This distinction helps prevent preliminary figures from being treated as final results.
6. Automate in stages
Trying to automate the entire reporting environment at once can introduce additional complexity.
A more controlled sequence is: data ingestion → validation → reconciliation → calculations → dashboards → approvals → report distribution → AI assistance.
The early phases often provide the largest operational benefit because analysts spend less time collecting, cleaning, and reconciling data.
AI can be introduced later for document processing, anomaly analysis, exception prioritization, and narrative generation once the underlying data and calculation processes are reliable.
7. Protect sensitive investment data
Portfolio and investor reporting systems contain valuations, financial statements, investor information, transaction records, and other sensitive data. Access should therefore follow the user’s role and reporting responsibilities.
Relevant controls include:
- Role-based permissions.
- Multi-factor authentication.
- Encryption in transit and at rest.
- Detailed access logs.
- Segregation of duties.
- Controlled report sharing.
- Regular access reviews.
- Monitoring for unusual activity.
Computools provides cybersecurity services that help investment firms embed access controls, audit trails, and financial data protection directly into reporting platforms, dashboards, and investor portals.
The Moblet financial platform illustrates how security can be embedded into financial data access. We implemented integrations with SWIFT, Visa, and Mastercard alongside two-factor authentication, fingerprint authentication, and real-time transaction tracking.
Investment reporting workflow case studies
Computools’ finance portfolio includes projects that demonstrate different parts of an investment data reporting environment, including portfolio analysis, risk calculation, automated financial reporting, financial data integration, and investor-facing analytics.
FDA Operator: investment and risk management in one platform
For FDA Operator, an Australian financial company needed an online platform capable of handling complex investment data, calculating potential income and risk, and giving investors access to different financial instruments.
Our team developed a scalable investment and portfolio management platform covering stocks from Australian and global companies as well as bank deposit products. The system processes large volumes of financial data, supports income and risk calculations, and lets users analyze historical market information. Microsoft SQL Server provides the underlying data platform, with ETL and reporting capabilities supporting financial data processing.
The case is particularly relevant to portfolio performance tracking and reporting because it shows how investment data, historical market information, income calculations, and risk analysis can be brought into one environment. Instead of separating return analysis from risk monitoring, the platform gives users access to both when evaluating investment options. Following implementation, the client reported a 46% increase in its customer base.
Finmap Online: automating financial reporting and portfolio oversight
The Finmap Online project demonstrates another important part of the reporting workflow: turning financial data from different activities into structured reports and analytics.
Computools worked on the platform’s engineering and data analytics capabilities. The resulting service includes automated financial reporting, API integrations, multi-currency support, algorithmic tools, financial planning, scheduled transactions, personalized analytics, and synchronization across web and mobile devices. It also supports oversight of both individual and corporate financial portfolios.
For investment firms, the same architectural principle is relevant when accounting records, cash movements, portfolio information, and other financial data have to feed a common reporting layer. Automated collection and synchronization reduce repeated data transfers, while analytics and controlled reporting views make financial information easier to use for different decisions.
Finmap Online also supports selective access to financial information and detailed report generation, demonstrating how reporting platforms can serve different user groups without exposing the complete dataset to every user.
A roadmap to better investment data reporting
The first step is understanding where manual work, inconsistent calculations, and reporting delays actually occur.
1. Map the existing reporting process
Start by documenting the current reporting cycle from source data to final distribution.
For each step, record:
- Data source.
- File or system used.
- Responsible team.
- Manual actions.
- Calculations performed.
- Reconciliation requirements.
- Approval steps.
- Final output.
- Reporting frequency.
This often reveals duplicated work. The same portfolio data may be copied into several spreadsheets, reconciled independently by different teams, and then entered again into an investor report or presentation.
Mapping these dependencies helps identify which processes should be automated first.
2. Identify the highest-cost bottlenecks
Prioritize areas that consume analyst time or create reporting risk.
Common examples include:
- Collecting portfolio company data by email.
- Re-entering figures from spreadsheets.
- Manual FX conversion.
- Matching transactions across multiple systems.
- Recalculating the same KPIs for different reports.
- Resolving inconsistent entity names.
- Rebuilding quarterly presentations manually.
- Maintaining several versions of the same report.
- Waiting for approvals through email.
- Investigating errors only at the end of the reporting cycle.
A useful prioritization method is to assess each problem by reporting hours consumed, frequency, error risk, and impact on report delivery.
3. Define a common investment data model
Before connecting additional systems, firms need consistent definitions for the data they want to report.
The model should establish common structures for:
- Funds.
- Investment vehicles.
- Portfolio companies.
- Securities.
- Investors.
- Transactions.
- Cash flows.
- Valuations.
- Currencies.
- Reporting periods.
- Portfolio KPIs.
This creates a translation layer between existing applications.
4. Connect source systems incrementally
Once the data model is established, firms can integrate systems according to business priority rather than attempting a large-scale replacement program.
A typical sequence may be:
- Accounting and fund administration.
- Portfolio company reporting.
- Custodian and market data.
- CRM and deal-management systems.
- Internal spreadsheets and valuation models.
- Additional external providers.
This approach allows the firm to preserve systems that still perform their core functions effectively while centralizing reporting across them.
Computools fintech software development expertise supports this type of integration when investment platforms need APIs, data synchronization, workflow logic, or connections with external financial services.
Final thoughts
For many organizations, the current reporting process is inefficient because data associated with portfolios, records, markets, risks, and investor data are stored and reconciled separately.
An effective way to handle investment data reporting is to develop a governed data layer that connects various systems, standardizes calculations, checks the integrity of the inputs, and preserves the audit trails. This way, all portfolio teams can use the same validated data for monitoring performance, assessing risks, and producing reports for their management and client discussions.
A practical modernization roadmap can be divided into several phases:
Phase 1. Consolidate data
Connect the most important sources and establish common entity definitions.
Phase 2. Standardize calculations
Move critical KPIs and performance calculations into controlled logic.
Phase 3. Automate reconciliation
Introduce validation rules and exception workflows.
Phase 4. Centralize reporting
Create dashboards, management reports, and investor reporting from the same governed dataset.
Phase 5. Add advanced automation and AI
Use AI for document processing, exception analysis, report commentary, and other tasks where it can reduce manual effort without becoming the source of financial truth.
This iterative process is less disruptive to the organization and allows the existing systems to continue handling accounting, CRMs, portfolio management, and administration functions. The reporting layer joins these disparate systems and offers teams a consolidated view of performance, risk, liquidity, and client data.
Сomputools investment software development services cater to investment firms that need to connect existing financial systems, standardize portfolio data, automate calculations, and create reporting interfaces for investment teams, management, risk functions, and investors.
Computools
Software Solutions
Computools is an IT consulting and software development company that delivers innovative solutions to help businesses unlock tomorrow.