THE AUTHOR:

An energy asset monitoring platform is becoming critical as power systems grow more distributed, data-heavy, and difficult to manage manually. The International Energy Agency reports that global electricity demand grew by 3% in 2025 and is forecast to rise by an average of 3.6% annually from 2026 to 2030, while global renewable power capacity is projected to increase by almost 4,600 GW between 2025 and 2030.
This growth adds more distributed assets, sensors, meters, storage systems, and connected devices to energy infrastructure, making IoT data essential for real-time visibility and faster operational response. At the grid level, the IEA notes that digital technologies can help utilities locate and fix faults faster, reduce outage-related disruption, improve maintenance, extend asset lifetimes, and defer an estimated USD 1.8 trillion in grid investment globally by 2050.
Market data points in the same direction: Precedence Research estimated the global IoT in energy market at USD 34.42 billion in 2025 and projected it to reach USD 123.93 billion by 2035, reflecting growing demand for connected energy infrastructure, predictive maintenance, and real-time operational analytics.
How Computools developed a custom energy asset monitoring platform for winder
Although the Winder project focused on critical facility security, its technical logic closely aligned with an energy asset monitoring platform: the system connected energy-related devices, supported real-time calculations, and used predictive algorithms to improve safety and operational efficiency.
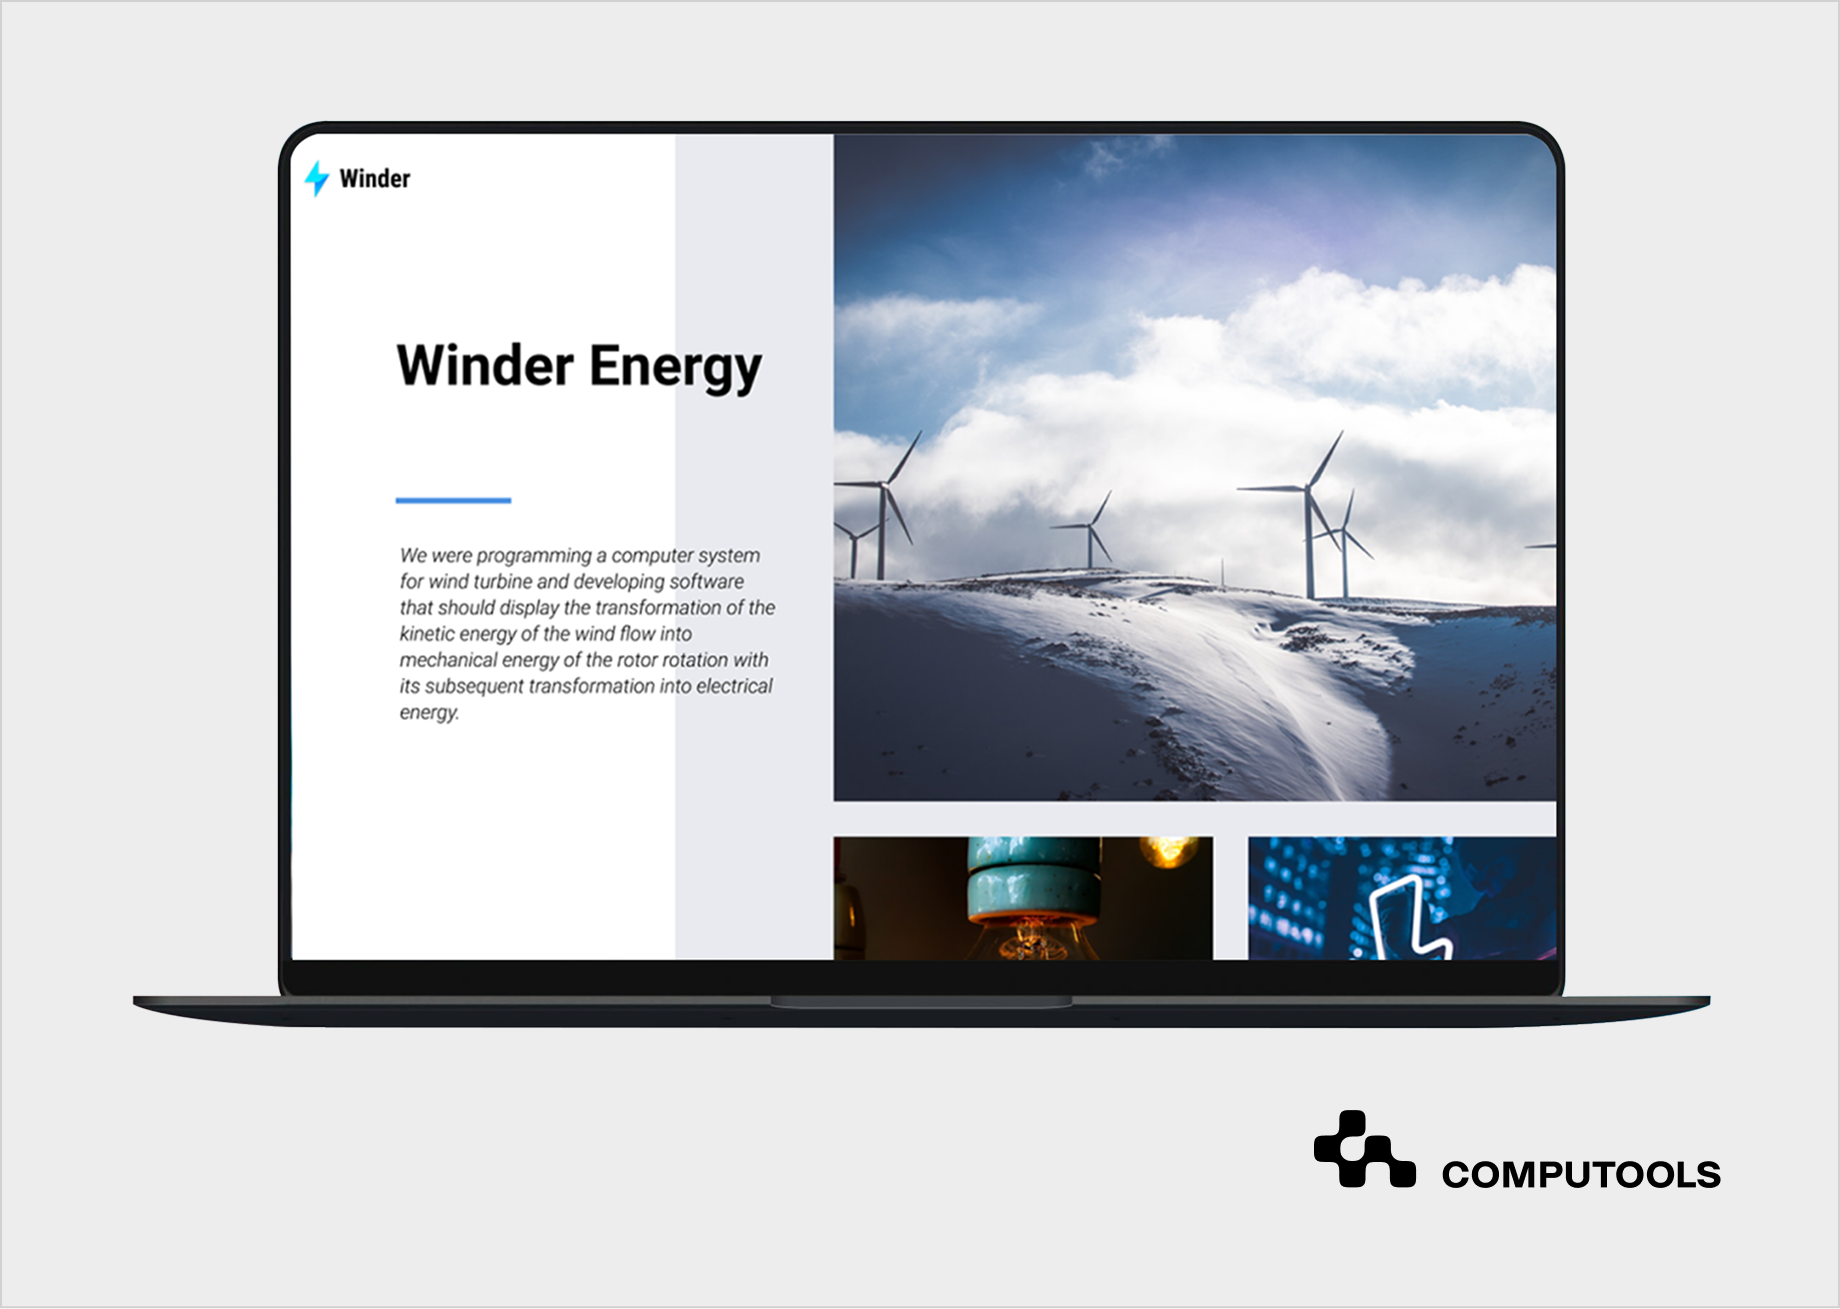
Winder is a global energy company that builds and maintains systems for securing critical facilities and infrastructure. The client needed to improve the reliability and performance of large physical facilities where accurate calculations, timely risk detection, and compliance with safety standards were essential. However, its existing systems were complex, highly customized, and often required expert investigation because they could not process calculations in real time.
Computools started with discovery, expert consultations, and technical research. The team analyzed device API capabilities, field communication strategies, algorithm requirements, and user workflows. This stage reflected Computools’ experience in energy software development services, where technical architecture must support both operational performance and industry-specific safety requirements.
The final solution worked as a real-time energy monitoring system for energy-related devices. It integrated multiple devices into a single environment, enabled real-time calculations, and used predictive algorithms to support faster, more accurate decisions in critical facility operations.
A strong data engineering layer was central to the project. The system had to process various types of device data, support both structured and unstructured storage, and prepare information for calculations, alerts, and predictive analytics. As a result, Winder improved safety control, operational visibility, and resource allocation across its critical infrastructure.
How to develop a real-time energy asset monitoring platform using IoT data in 10 steps
1. Audit energy assets, risks, and monitoring gaps
The first step in developing an energy asset monitoring platform is to understand which assets need to be monitored, how they operate, and where current visibility gaps pose operational or safety risks. This stage should cover not only physical equipment, but also existing monitoring tools, data sources, maintenance workflows, incident response procedures, and business-critical performance indicators.
For energy companies, monitored assets may include substations, transformers, generators, meters, battery systems, renewable energy assets, industrial equipment, safety systems, or facility infrastructure. Each asset type has different operating conditions, failure patterns, data requirements, and response priorities. A transformer overload, a battery temperature anomaly, a communication loss from a field device, or an incorrect calculation in a critical facility may require completely different monitoring logic.
During the audit, the project team should define:
• which assets are critical to operational continuity;
• which parameters are already measured;
• which data is missing, delayed, duplicated, or unreliable;
• how asset failures are currently detected;
• which processes still depend on manual checks or expert investigation;
• what safety, compliance, and reporting requirements must be supported;
• which systems already store operational, maintenance, or asset data;
• what level of real-time visibility do different user roles need.
This stage is also where the team separates useful monitoring goals from vague expectations. “We need better visibility” is not enough. The platform should be tied to specific business and operational outcomes, such as faster incident response, fewer manual inspections, more accurate calculations, better asset utilization, safer facility operations, or improved maintenance planning.
In the Winder project, this audit was especially important because the client operated large physical facilities where accurate calculations were directly connected to safety standards and operational efficiency. Existing systems were complex, highly customized, and often required expert investigation because they could not perform real-time calculations. Computools first analyzed the client’s operational context, device capabilities, communication limitations, and risk scenarios before defining how the future system should process data and support decision-making.
A detailed audit reduces the risk of building a platform that collects data without improving operations. It gives the development team a clear technical and business foundation for architecture, IoT connectivity, analytics, dashboards, and alert logic. Without this stage, companies risk building a dashboard that visualizes data without improving incident response, maintenance planning, or operational decision-making.
2. Define platform requirements and sector-specific constraints
After the asset audit, the next step is to translate operational needs into clear platform requirements. At this stage, the team defines what the system must monitor, how fast it should process data, which users will rely on it, and what decisions it should support.
A real-time monitoring solution for energy infrastructure cannot be designed as a generic dashboard. Different asset types, facilities, and operating environments require different levels of data accuracy, system availability, alert logic, access control, and integration depth. For example, a platform used for substations, industrial facilities, renewable assets, or secure physical infrastructure may need different monitoring rules, reporting formats, and response workflows.
For companies building industrial IoT energy solutions, requirements should usually cover:
• asset groups and operating modes;
• critical parameters for each asset type;
• required data update frequency;
• acceptable latency;
• alert thresholds and escalation rules;
• user roles and access levels;
• reporting and audit requirements;
• cybersecurity requirements;
• mobile and web access needs;
• integration with existing operational systems;
• scalability for new assets, sites, and data sources.
This step also involves defining how “real-time” works in practice. Not all data updates need to be every second; some require immediate alerts, while others are for reporting, trends, or maintenance. Separating these data flows early prevents unnecessary infrastructure costs and maintains operational focus.
For Winder, the requirements were shaped by the safety-critical nature of the client’s facilities. The system had to support real-time calculations, process data from different energy-related devices, and help teams make faster decisions in situations where manual expert investigation slowed response. Computools also had to consider how the platform would support predictive analysis, device configuration, and more accurate resource allocation.
A strong requirements phase reduces the risk of building a technically functional system that does not match field conditions. It gives the development team a precise foundation for architecture, IoT connectivity, analytics logic, interface design, and future scaling.
3. Map IoT devices, data sources, and communication protocols
The next step is to map how operational data will enter the system. IoT energy asset monitoring depends on reliable data collection from physical assets, field devices, control systems, and existing software. If this layer is poorly designed, the platform will receive incomplete, delayed, or inconsistent data, which can weaken calculations, alerts, and performance analysis.
The team should identify all data sources that will feed the platform, including sensors, smart meters, controllers, gateways, SCADA-connected devices, field equipment, safety systems, maintenance databases, legacy applications, device APIs, and manual input points, if they are still part of the workflow.
For each source, the team should define what data it provides, how often it updates, how accurate it is, who owns it, and whether it can support real-time processing. This is also where engineers check whether devices are already connected, partially connected, or still isolated from digital workflows. Having sensors in place does not automatically mean that the data is complete, reliable, or ready for operational use.
Communication protocols and field connectivity should be assessed early. Depending on the infrastructure, the platform may need to work with MQTT, OPC UA, Modbus, REST APIs, Ethernet, cellular networks, Wi-Fi, LoRaWAN, or custom device communication logic. The choice depends on asset location, network stability, latency requirements, security policies, and the type of data being transmitted.
This step should also cover data reliability issues, such as missing readings, delayed messages, duplicate data, unstable device connections, inconsistent measurement units, unsynchronized timestamps, incorrect sensor values, and limited connectivity in remote or industrial environments.
For energy infrastructure, these issues are not minor technical details. A delayed fault signal, an incorrect timestamp, or a missing temperature reading can affect maintenance decisions, safety responses, and asset performance analysis.
In the Winder project, Computools examined device API capabilities and communication strategies before implementation. This defined how energy devices exchange data and how the platform processes it for real-time and predictive analysis.
A detailed device and data map gives the development team a practical foundation for architecture, storage, alert logic, and integrations. It also helps the client understand which parts of the existing infrastructure are ready for real-time monitoring and which need additional connectivity, data preparation, or hardware-level changes.
4. Design the architecture and real-time data pipeline
After mapping assets, devices, and data sources, the next step is to design the technical architecture of the future IoT platform for energy assets. This architecture defines how data will move from physical equipment to the platform, how it will be processed, where it will be stored, and how users will access it through dashboards, reports, alerts, or integrated systems.
The architecture should support both real-time and historical data workflows. Real-time processing is needed for live asset status, safety-related alerts, fault detection, communication loss events, and operational calculations. Historical data is needed for trend analysis, maintenance planning, performance comparison, audit trails, and long-term reporting.
A typical architecture should include:
• a device connectivity layer for sensors, meters, controllers, gateways, and connected equipment;
• a data ingestion layer for receiving and routing incoming data streams;
• a validation and normalization layer to clean and standardize device data;
• a real-time processing layer for events, alerts, and calculations;
• structured and unstructured data storage;
• an analytics layer for performance analysis and predictive models;
• an API layer for integrations with enterprise and operational systems;
• a dashboard and reporting layer for users;
• security controls for access, transmission, and device communication;
• deployment infrastructure that supports scalability and fault tolerance.
The development team should decide which parts need cloud, edge, or hybrid processing. Edge processing suits remote locations, unstable networks, or close-to-equipment calculations. Cloud handles centralized analytics, multi-site visibility, reporting, and scalable storage.
The architecture should define data latency needs, as not all data require the same speed. Safety events need immediate processing, while monthly reports can use historical data. Setting priorities early reduces costs and keeps the system focused on operational needs.
For Winder, architecture planning was closely tied to performance, reliability, and calculation accuracy. The system had to connect different energy-related devices, process operational data, and support real-time calculations for critical facility operations. Computools used Java for the core system logic, Golang and C++ for performance-critical components, PostgreSQL and MongoDB for different data types, and Docker with Kubernetes to support stable deployment, scalability, and fault tolerance.
A well-designed software architecture gives the platform enough flexibility to support new assets, data sources, analytics modules, and integrations later. It also reduces the risk of rebuilding the system when the company expands monitoring across more facilities, devices, or operational scenarios.
5. Build IoT data ingestion, validation, and storage logic
The next step is to build the data layer that receives, checks, organizes, and stores incoming IoT data. This layer is critical because real-time monitoring depends on the quality of the data entering the system. If the platform receives incomplete, duplicated, delayed, or poorly structured data, alerts and analytics will become unreliable.
The ingestion layer should support data from multiple sources, including sensors, smart meters, controllers, gateways, field systems, APIs, and legacy software. It should be able to process both continuous data streams and event-based messages, depending on how the connected assets operate.
At this stage, the development team should define how the system will handle:
• incoming data streams from different devices;
• message routing and prioritization;
• timestamp alignment;
• duplicate records;
• missing or delayed readings;
• inconsistent measurement units;
• abnormal values;
• structured and unstructured data;
• historical data storage;
• audit logs and traceability.
Data validation should be designed together with domain experts. A software rule alone may not be enough to decide whether a reading is incorrect, risky, or normal for a specific operating mode. Temperature, voltage, vibration, load, pressure, or energy output values may need different validation rules depending on the asset type, location, operating conditions, and safety requirements.
Storage architecture matters; real-time data, historical records, metadata, maintenance logs, and event logs need different storage models. Structured databases support reporting and asset records, while document or time-series storage suit flexible device data, logs, and high-frequency readings.
For Winder, this layer was important because the system had to process data from different energy-related devices and prepare it for real-time calculations and predictive analysis. Computools used PostgreSQL for structured data and MongoDB for unstructured data, which helped support different types of information within one technical environment.
A reliable data layer provides the platform with a stable foundation for monitoring, alerting, analytics, reporting, and future scaling. In broader energy monitoring platform development, this step often determines whether IoT data becomes operationally useful or remains a fragmented stream of technical readings.
6. Develop real-time monitoring, alerts, and event logic
Once the data layer is stable, the platform can start turning incoming data into operational signals. This step defines how the system detects abnormal behavior, identifies critical events, prioritizes alerts, and helps users respond before an issue becomes a failure.
The monitoring logic should be built around asset type, operating mode, risk level, and business impact. A single threshold is rarely enough for energy infrastructure. The same temperature, load, vibration, voltage, or communication delay may be acceptable in one operating condition and critical in another. This is why alert rules should combine engineering input, historical patterns, device specifications, and safety requirements.
The platform should support several types of monitoring logic:
• live asset status monitoring;
• threshold-based alerts;
• anomaly detection;
• communication loss detection;
• fault code processing;
• safety-related warnings;
• event classification;
• alert prioritization;
• escalation workflows;
• incident history;
• notification rules for different user roles.
A real-time energy monitoring system should also distinguish between informational events, warnings, and critical alerts. If every signal becomes an urgent notification, users will stop trusting the system. Alert fatigue is a serious operational risk, especially in environments where teams already work with multiple control systems and maintenance tools.
For critical facilities, event logic should also include escalation paths. The system should define who receives the alert, what information they see, how quickly they need to respond, and whether the event should trigger a maintenance task, safety procedure, inspection, or management-level report.
In the Winder project, real-time calculations were one of the core requirements. The client’s existing systems often required expert investigation, which slowed decision-making. Computools developed logic that helped process device-related data faster, support predictive analysis, and improve response to potential operational risks.
At this stage, monitoring should map each event to a clear response, showing the affected asset, issue severity, related data, next steps, and responsible team. This makes alerts useful for incident response, maintenance, and safety, rather than leaving teams to interpret raw signals.
7. Add predictive analytics and maintenance intelligence
After the platform can process real-time events, the next step is to add analytics that identify early signs of degradation, recurring failures, and abnormal asset behavior. This layer is especially important for companies that manage high-value or distributed energy assets, where unplanned downtime can affect safety, service continuity, and operating costs.
Predictive logic should be based on both historical and live operational data. The system can analyze how assets behave over time, compare current readings with normal performance patterns, and detect deviations before they become critical incidents. This is where predictive maintenance for energy assets becomes practical: maintenance decisions are based on actual asset condition rather than fixed schedules or delayed manual inspections.
The analytics layer may include:
• asset health scoring;
• failure pattern detection;
• performance degradation analysis;
• abnormal behavior detection;
• risk scoring by asset, site, or device group;
• event forecasting;
• maintenance priority recommendations;
• comparison between similar assets;
• configuration impact analysis;
• long-term performance trends.
For this layer to be reliable, analytics models need clean historical data, correct asset context, and domain validation. A model cannot properly interpret equipment behavior if it lacks knowledge of the asset type, operating mode, load conditions, maintenance history, or environmental factors. For example, the same vibration level may indicate normal operation for one device and early-stage failure for another.
This step should also define how recommendations are presented to users. The platform should not only flag a potential issue but also show the related asset, supporting data, severity level, possible cause, and recommended action. For critical infrastructure, every recommendation should be traceable, explainable, and reviewed through the right operational workflow.
In the Winder project, predictive algorithms were part of the solution logic. Computools developed functionality to support event prediction, decision-making across different operational scenarios, and analysis of how devices could be placed or configured to improve safety and performance.
At this stage, analytics should produce practical outputs: risk scores, maintenance priorities, supporting data, and traceable recommendations for operational teams. It gives companies a clearer view of which assets require attention, which risks are increasing, and where preventive action can reduce operational disruption.
For a deeper look at how AI supports demand forecasting, grid optimization, predictive maintenance, and operational analytics, read our article on AI in the energy industry.
8. Design dashboards, reports, and role-based interfaces
Once monitoring and analytics logic are defined, the next step is to design how users will interact with the platform. In energy operations, the interface should not simply display data. It should reduce the time needed to understand asset status, assess risk, and decide what action is required.
The dashboard structure should be based on user roles and operational priorities. Engineers, field technicians, facility managers, security teams, and executives usually need different levels of detail. A technical user may need asset-level diagnostics and event history, while a manager may need site-level performance, risk summaries, maintenance status, and resource allocation data.
The platform interface should support:
• real-time asset status views;
• asset hierarchy by site, system, device, or equipment type;
• alert panels with severity levels;
• event history and incident records;
• performance charts and historical trends;
• predictive risk indicators;
• maintenance-related information;
• reports for compliance, safety, and operations;
• role-based access control;
• audit trails;
• filters by asset, location, time period, and event type.
For complex systems, interface design should start before full development, not after backend logic is already fixed. User personas, site maps, wireframes, and interface prototypes help validate how different teams will move through the system and which information they need first. This is especially important for remote energy asset monitoring, where users may need to understand asset conditions without being physically present at the facility.
The dashboard should also separate live operational views from analytical and reporting views. Real-time screens should focus on current status, alerts, and response actions. Analytical screens can show trends, degradation patterns, comparative asset performance, and historical reports. Mixing everything into one interface usually makes the system harder to use.
In the Winder project, Computools worked through user personas, site maps, wireframes, and user interface design to make a complex technical system easier to operate. Angular was used for the web interface, while Flutter supported mobile access for users who needed visibility beyond the desktop environment.
A well-designed interface should clearly show the affected asset, current condition, related data, risk level, and next operational step. This reduces manual interpretation and makes the platform more useful for incident response, maintenance planning, and management reporting.
9. Integrate the platform with enterprise and operational systems
A monitoring platform should fit into the company’s existing operational environment. Energy teams usually already work with SCADA, maintenance systems, ERP, GIS, reporting tools, internal databases, and asset registers. If the new platform stays isolated, users still have to move data manually between systems, and the value of real-time monitoring becomes limited.
The integration layer should define which systems need to exchange data with the platform and what each integration should support.
Common integrations include:
• SCADA or control systems for operational data;
• CMMS for maintenance tasks, work orders, and service history;
• ERP for resource planning, procurement, and cost control;
• GIS for location-based asset views;
• EMS for energy performance and consumption data;
• asset registers for equipment metadata;
• reporting and compliance tools;
• internal APIs and data warehouses;
• identity and access management systems.
For energy asset management software, integrations are especially important because asset status, maintenance history, risk indicators, and performance data should not live in separate systems. Operators need current technical data, while managers need a broader view of resource use, asset condition, maintenance cost, and operational risk.
The team should define data ownership and synchronization rules early. Some systems may remain the source of truth for asset metadata, while the monitoring platform becomes the source of real-time operational status. Without this separation, duplicate records, outdated asset information, and conflicting reports can quickly appear.
Integration design should also cover:
• API structure;
• data formats;
• update frequency;
• error handling;
• authentication;
• permission mapping;
• audit logs;
• fallback behavior if one system is unavailable.
For Winder, integration was central because the client needed to connect various energy-related devices and make their data usable within a single system. Computools analyzed device APIs and field communication logic during discovery, then designed the platform to support real-time calculations, predictive analysis, and more accurate resource allocation.
A strong integration layer helps the platform become part of daily operations rather than a separate technical tool. It connects monitoring data to maintenance, reporting, planning, and decision-making workflows, where the business value becomes measurable.
10. Test, secure, deploy, and scale the platform
Before the platform goes live, the team should test how it performs under real operating conditions. This includes software testing, device connectivity, data accuracy, calculation logic, alert behavior, user permissions, integrations, and system performance under load.
For energy infrastructure monitoring, testing should cover scenarios that reflect actual operational risks:
• device disconnection or unstable connectivity;
• delayed or missing IoT data;
• incorrect sensor readings;
• high-frequency data streams;
• simultaneous alerts from multiple assets;
• failed API requests;
• role-based access restrictions;
• dashboard response time;
• integration failures;
• backup and recovery procedures.
Security testing should be an integral part of deployment, not a final step. Connected energy assets increase the attack surface, especially with IoT devices, field systems, APIs, and remote access. The team must verify encryption, device authentication, access control, network segmentation, audit logs, secure API communication, vulnerability management, and incident response. Deployment usually begins with a controlled pilot to validate data flows, alert accuracy, user workflows, and integration stability before scaling. During the pilot, teams should compare platform outputs with real observations to ensure calculations, alerts, and recommendations are correct.
After deployment, the platform should be continuously monitored and improved. New assets, updated safety rules, additional data sources, regulatory changes, and operational feedback may require changes to the system. This is where smart energy asset management becomes an ongoing process rather than a one-time software launch.
In the Winder project, Computools used Scrum to support regular reviews, expert feedback, and iterative improvements. After implementation, the team also provided maintenance and updates to keep the system responsive to changing operational needs.
A successful launch means the platform is stable, secure, accurate, and usable in daily operations. It should support real-time visibility, reliable alerts, predictive insights, and scalable monitoring without disrupting the systems and teams already responsible for critical infrastructure.
Launch your real-time energy asset monitoring platform within 1–3 months instead of years. Unlock real-time visibility, proactive maintenance, and continuous performance optimization across your energy operations.
What mistakes should companies avoid when developing an energy asset monitoring platform?
1. Energy asset tracking without accurate asset metadata
A monitoring platform cannot function properly if assets are poorly classified, duplicated across different systems, or lack basic technical data. Before development starts, companies should verify asset IDs, locations, device types, ownership, maintenance history, operating modes, and criticality levels. This creates a reliable foundation for monitoring, alerts, reporting, and future integrations.
2. IoT data analytics for energy based on unvalidated data
Analytics becomes unreliable when the system uses incomplete, delayed, duplicated, or inconsistent IoT data. Before building dashboards or predictive models, the team should design data validation rules, timestamp alignment, unit standardization, anomaly filters, and data quality checks. Otherwise, the platform may generate false alerts, miss early signs of failure, or show misleading performance trends.
3. Real-time alerts are built on static thresholds only
Static thresholds are useful, but they are rarely enough for complex energy infrastructure. If alert logic does not reflect operating conditions, asset behavior, and risk severity, teams may receive too many false positives or miss important events. Alert rules should combine thresholds, anomaly detection, event history, and escalation logic.
4. Device integration was planned too late
IoT devices, controllers, gateways, and legacy systems often use different protocols, formats, and update frequencies. If integration planning starts after the platform architecture is already fixed, the team may face avoidable rework. Device APIs, communication protocols, connectivity limits, and cybersecurity requirements should be mapped during discovery.
5. Energy asset performance is measured without operational context
Asset performance cannot be evaluated by raw readings alone. The same temperature, load, vibration, voltage, or output level may mean different things depending on asset type, operating mode, location, weather, demand, or maintenance history. Performance logic should include engineering rules, historical patterns, and asset-specific thresholds, not only generic metrics.
6. Dashboards designed before monitoring logic
A dashboard is only useful when the data behind it is accurate and actionable. If interface design starts before data ingestion, validation, calculations, and alert logic are defined, users may see attractive charts without reliable operational meaning. Dashboards should reflect real workflows, user roles, asset hierarchy, and response procedures.
7. Scaling before pilot validation
Rolling out the platform across many assets or sites too early can multiply data errors, integration issues, and workflow gaps. A controlled pilot helps validate device connectivity, data quality, alert accuracy, user permissions, dashboard usability, and integration stability before scaling the system further.
Why choose Computools for energy asset monitoring platform development?
Computools approaches energy software development as a business outcome, not just an engineering task. Each project is structured around clear KPIs, phased delivery, launch readiness, and a roadmap to measurable ROI, helping energy companies reduce execution risk and turn digital initiatives into operational value.
For energy companies, this approach is especially important. A real-time asset monitoring platform affects maintenance costs, asset visibility, field operations, safety response, regulatory reporting, and IT infrastructure performance. That is why Computools combines product strategy, software engineering, UX, AI automation, analytics, and post-launch support into a single delivery process.
Our energy software development services cover utilities, energy producers, green tech startups, electric power companies, and oil and gas enterprises. Computools works across electric power software development and oil and gas software development, helping companies modernize legacy systems, connect operational data, automate manual processes, and improve visibility across distributed assets.
The company’s energy experience includes IoT-based monitoring systems, smart grid platforms, predictive analytics software, ESG compliance solutions, field operation tools, and utility data management products. Computools reports a 45% gain in operational efficiency, a 35% reduction in energy waste, 40+ delivered energy projects, and a team of 250+ experts.
This expertise is supported by relevant case studies. For Winder, Computools developed a customized system for critical facility security, real-time calculations, device integration, and predictive analysis. For Drone Analytics, the team built a web-based system that unified drone inspection data and improved turbine maintenance. For MeterSnap, Computools delivered a mobile solution using computer vision and neural networks to support utility data collection in low-connectivity environments.
Computools also supports the full product lifecycle. Web development services help create role-based dashboards, reporting tools, and operational interfaces for managers, engineers, and control teams. Mobile app development services support field teams that need access to asset data, alerts, inspections, and maintenance workflows outside the control room. AI development can strengthen monitoring platforms with anomaly detection, predictive maintenance, image recognition, forecasting, and intelligent automation.
The delivery model is phased and transparent, with defined outputs, validation points, and business logic at each stage: discovery, architecture, prototype or MVP, development, integration, testing, deployment, and post-launch optimization. This allows clients to validate technical decisions, user workflows, data quality, and ROI assumptions before scaling the platform.
For companies developing an energy asset monitoring platform, Computools helps create a scalable solution that reduces manual operations, improves asset performance, supports faster decision-making, opens new digital revenue opportunities, and strengthens the company’s market position through measurable digital transformation. Contact us at info@computools.com for more information.
For companies comparing potential technology partners, our guide to the top energy software development companies can help evaluate providers by industry focus, delivery experience, and energy software expertise.
Conclusion
Energy companies need a system that shows asset condition in real time, detects risks early, supports maintenance decisions, and links operational data with business outcomes, rather than a disconnected dashboard. A good monitoring platform reduces blind spots, improves failure response, controls costs, and measures asset performance.
For critical facilities, grids, renewable, or industrial systems, this lowers operational risk and boosts resilience. Computools helps energy businesses from fragmented monitoring to scalable, data-driven operations with clear KPIs, phased delivery, and an ROI roadmap.
For oil and gas companies working with distributed assets, field operations, and high-volume operational data, our article on big data in the oil and gas industry explains how data platforms support safer operations, predictive maintenance, and faster decision-making.
Computools
Software Solutions
Computools is an IT consulting and software development company that delivers innovative solutions to help businesses unlock tomorrow.


